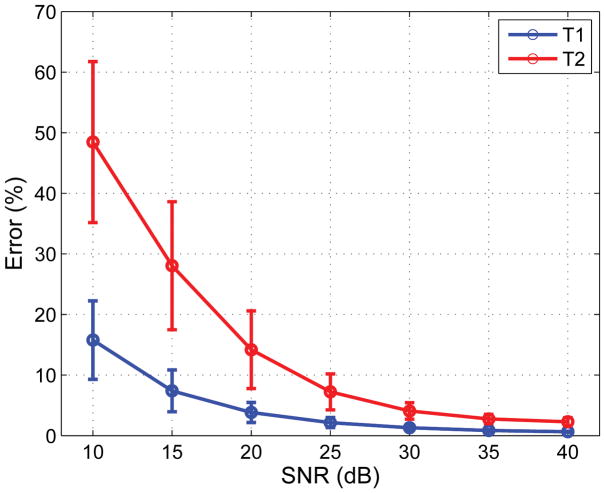
Fig. 4.
The T1 and T2 reconstruction error in percent as a function of the SNR. The mean (circles) and standard deviation (whiskers) were calculated across the 100 Monte Carlo iterations. Reconstructions at the lowest SNR level showed significant error that nevertheless dropped rapidly with increasing SNR and was less than 2% for T1 and T2 at the highest SNR level tested.

