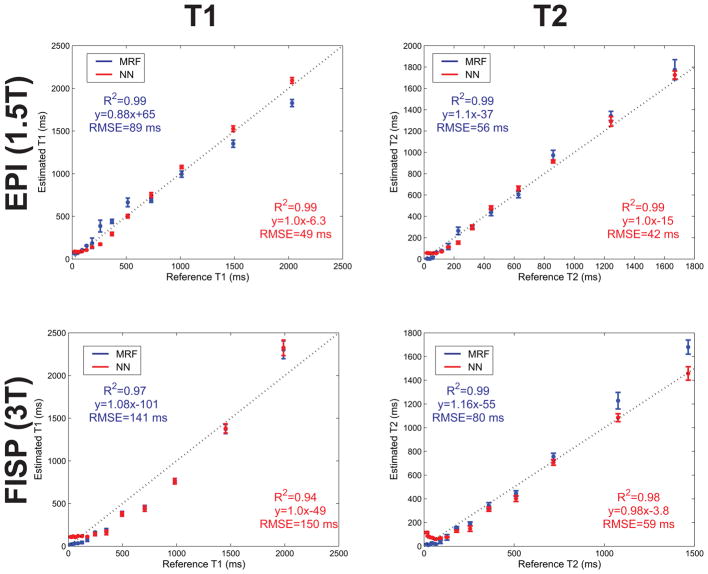
Fig. 5.
NN and MRF dictionary matching reconstructions of the ISMRM/NIST phantom for the sequences tested. Shown is a comparison between the reference and measured compartment T1 and T2 values for data acquired with the optimized MRF EPI sequence at 1.5T (top) and with the MRF FISP sequence at 3T (bottom). The reference values were calculated by NIST using spectroscopic inversion-recovery and spin-echo sequences. The dashed line is the identity line and the error bars represent the standard deviation of the measured T1 and T2 values within each compartment. The uncorrected larger B1 inhomogeneity at 3T may have contributed to the larger T1 RMSE with the MRF FISP sequence.

