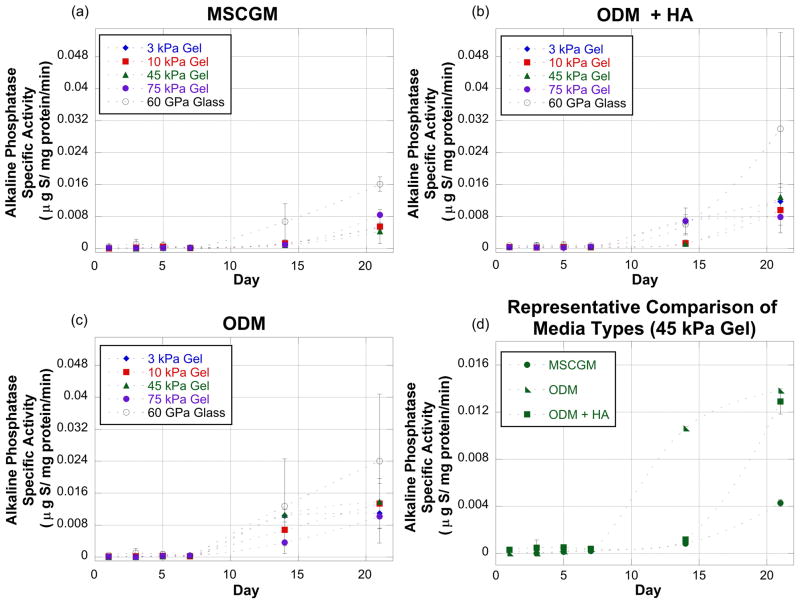
Figure 4.
Alkaline phosphatase (ALP) specific activity measured at Days 1, 3, 5, 7 and 21 for the various substrates and culture conditions. Graphs (a–c) represent ALP activity measurements for cells exposed to MSCGM (a), ODM (b), and ODM+HA (c) culture conditions on a range of substrate stiffness values. Graph (d) is a representative comparison of all three culture conditions for one substrate. The media condition graphs (a, b, and c) show that by Day 21 the stiffest substrate (glass) always induced the greatest ALP production. The representative comparison graph (d) shows that the MSCGM media condition resulted in the lowest ALP production when the substrate was glass. This trend (MSCGM resulting in the lowest ALP production) was true for all substrates.

