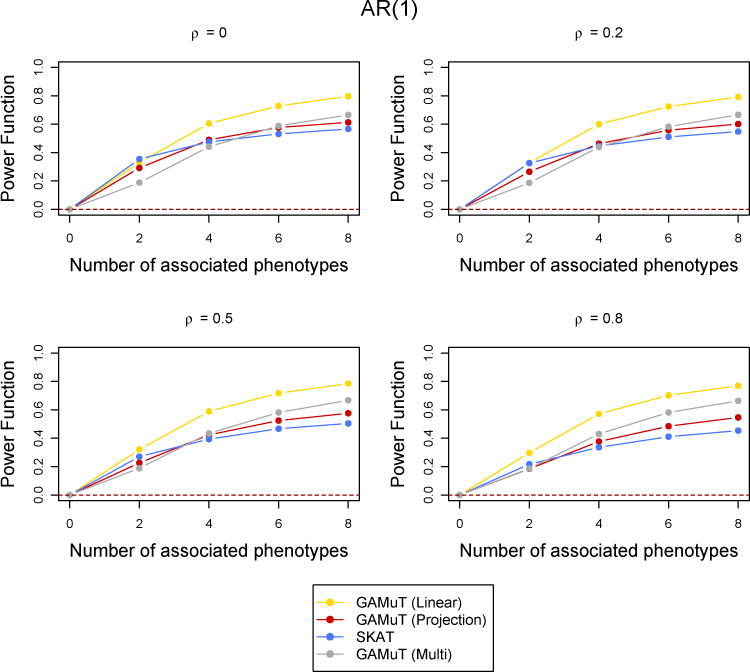
Figure 4.

Comparison of power curves for different methods in the binary phenotypes case. The correlation structure across time is considered to be AR(1) with parameter ρ and the tests are done at the p-value threshold 5 × 10⁻⁶. The value of the power function corresponding to 0 associated phenotypes shows the type-I error and the horizontal dotted line indicates the level of the test.
