
Figure 6.
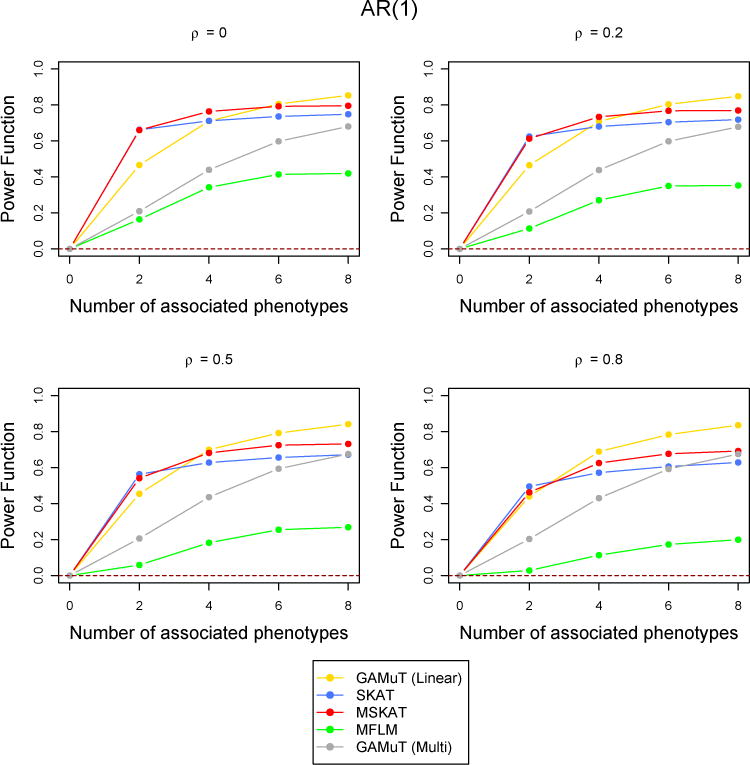
Comparison of power curves for different methods in the linear time effect set up when the correlations between phenotypes were higher. The correlation structure across time is considered to be AR(1) with parameter ρ and the tests are done at the p-value threshold 5 × 10⁻⁶. The value of the power function corresponding to 0 associated phenotypes shows the type-I error and the horizontal dotted line indicates the level of the test.