
Figure 7.
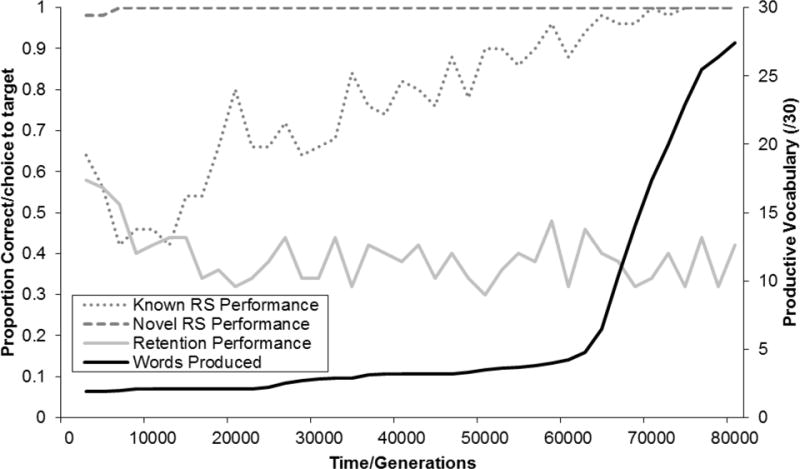
Results of Simulation 2. Performance of the model on the task is plotted as proportion correct along the left y-axis. Overall productive vocabulary (dark line) is plotted along the right y-axis.
Official websites use .gov
A
.gov website belongs to an official
government organization in the United States.
Secure .gov websites use HTTPS
A lock (
) or https:// means you've safely
connected to the .gov website. Share sensitive
information only on official, secure websites.
Results of Simulation 2. Performance of the model on the task is plotted as proportion correct along the left y-axis. Overall productive vocabulary (dark line) is plotted along the right y-axis.