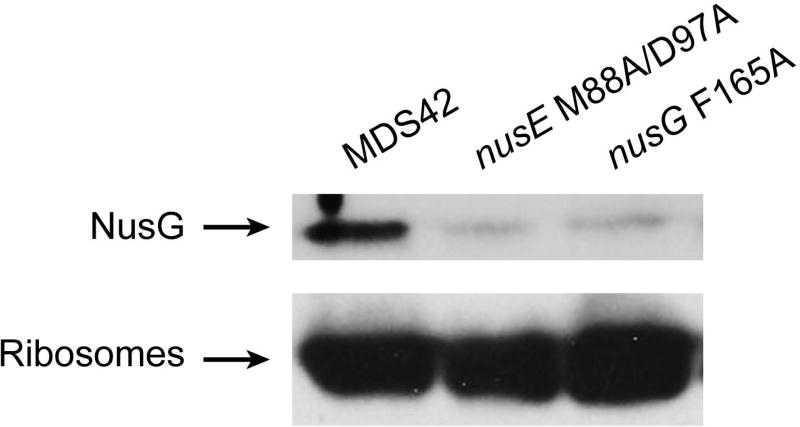
Figure 3. NusG:ribosome association in vivo.
Equal quantities of crude ribosome preparations from MDS42, MDS42 nusE M88/D97A (11601) and MDS42 nusG F165A (10780) were probed for NusG (top panel) and ribosomes (lower panel). The slight misalignment of bands was caused by the presence of sucrose in the samples.

