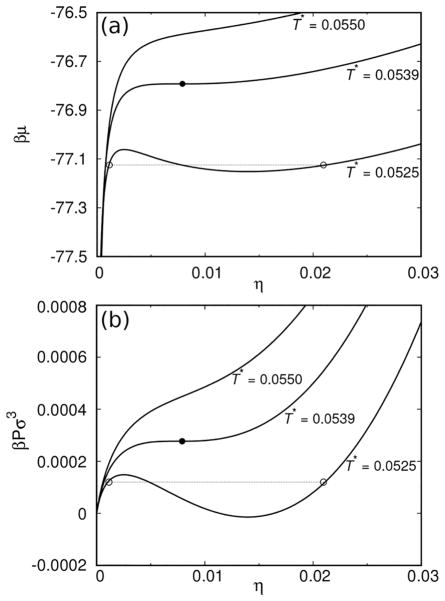
Figure 2.
(a) Reduced chemical potential βμas a function of the occupied volume, η, at various reduced temperatures, T* = kBT/ε. Top curve is supercritical, the middle one represents the critical isotherm, and the bottom one applies to conditions where phase separation takes place. The values of the reduced temperatures T* are for each graph shown on the figure. The open circles connected by the line denote the equilibrium points, while the full circle denotes the critical conditions. (b) The reduced pressure βPσ3 as a function of the occupied volume η. Notation as for panel (a).

