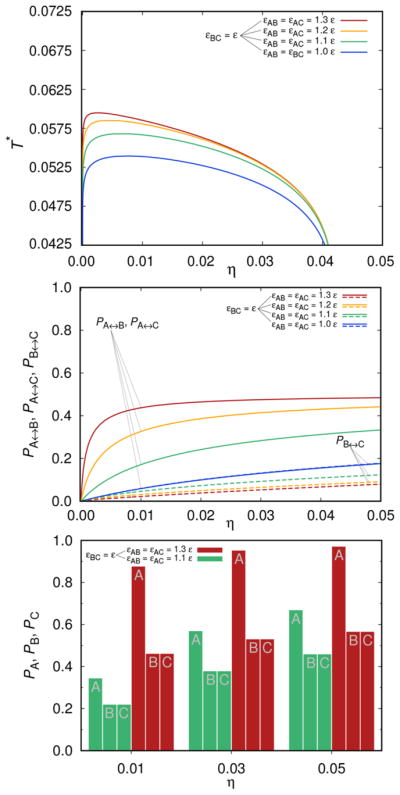
Figure 4.

Top panel shows the liquid–liquid separation curve: εBC = ε and constant, while εAB = εAC vary in the range from ε, 1.1 ε, 1.2 ε, to 1.3 ε (εAA = εBB = εCC = 0). Middle panel shows how the probability Pi↔j (i, j ∈{A, B, C}) varies with the attraction strength. Bottom panel: the histogram is showing PA, PB, and PC as a function of the volume fraction η of mAbs; kBT/ε = 0.0675.
