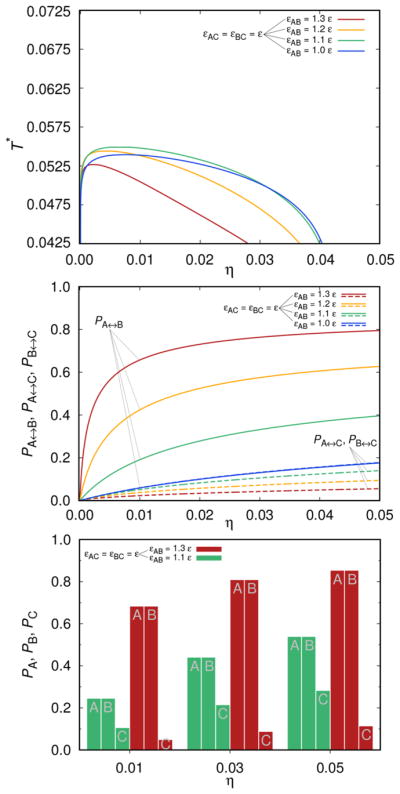
Figure 5.

Same as for previous two figures except that εAC = εBC = ε, while εAB varies in the range ε, 1.1 ε, 1.2 ε, and 1.3 ε. Top panel shows the liquid–liquid separation curves, the middle panel Pi↔j, and the bottom one PA, PB, and PC. Again kBT/ε = 0.0675 and ω = 0.05 σ.
