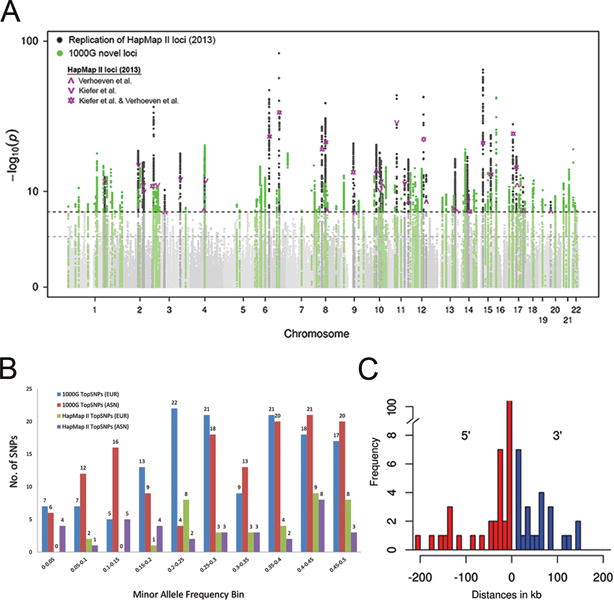
Figure 1. GWAS meta-analysis identifies 140 loci for refractive error (Stage 3).

(a) We conducted a meta-analysis of genome-wide single-variant analyses for >10 million variants in 160,420 participants of CREAM and 23andMe (Stage 3). Shown is the Manhattan plot depicting P for association, highlighting new (P < 5 × 10⁻⁸ for the first time; green) and known (dark grey) refractive error loci previously found using HapMap II imputations from Kiefer et al.27 and Verhoeven et al.26 (Table 1). The horizontal lines indicate suggestive significance (P=1×10⁻⁵) or genome-wide significance (P=5×10⁻⁸). (b) We compared the minor allele frequencies of the 140 discovered index variants based on 1000G (blue: Europeans; red: Asians) to the minor allele frequencies of the previously found genetic variants based on HapMap II (green: Europeans; purple: Asians). Observed are an increase in genetic variants found across all minor allele frequency bins increase, including the lower minor allele frequency bins. (c) We annotated the 167 loci to genes using wANNOVAR. Shown are the distances between index variants from the nearest gene and its gene on the 5′ and/or 3′ site. The majority of index variants (84%) were at a distance of less than 50 kb up- or downstream from the annotated gene.
