
Figure 2. Correlation of statistical significance and effect size of SNPs based on spherical equivalent (SphE) in diopters and age of diagnosis of myopia (AODM) in years.
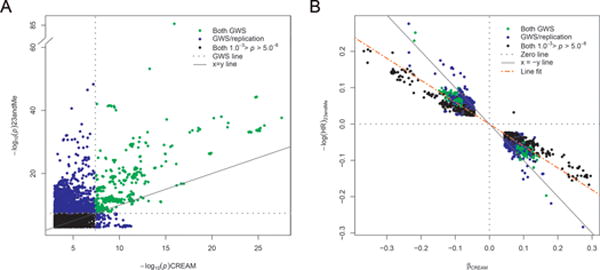
(a) P comparison of all genetic variants with P < 1.0 × 10⁻³ (n=7249) between CREAM meta-analysis (Stage 1) and 23andMe (Stage 2) meta-analysis. Shown is the overlap (red) and the difference (green) in P signals per cohort for genetic variants. Green genetic variants are only genome wide significant in either CREAM or 23andMe. Blue: genetic variants with P between 5.0 × 10⁻⁸ and 1.0 × 10⁻³ in both CREAM and 23andMe. (b) Comparison of effects (SphE and logHR of AODM in years; P < 1.0 × 10⁻³; n=7249) between CREAM and 23andMe. Same color code was applied as in (a). The effects were concordant in their direction of effect on refractive error. We performed a simple linear regression between the effects of CREAM and 23andMe; the regression slope is -0.15 diopters per logHR of AODM in years.