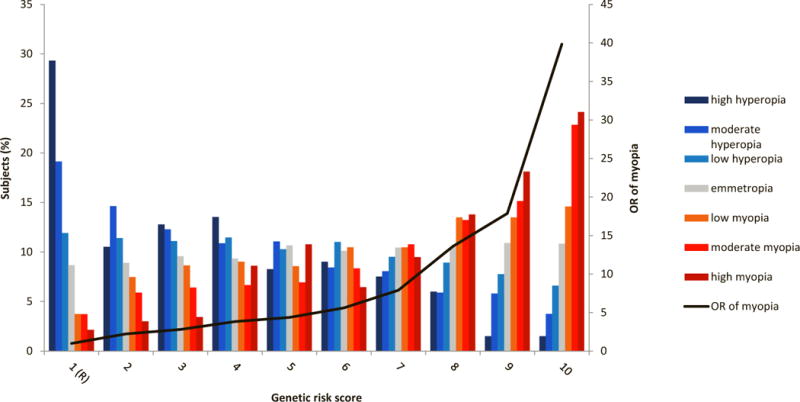
Figure 3. Risk of refractive error per decile of polygenic risk score (Rotterdam Study I-III, N=10,792).

Distribution of refractive error in subjects from Rotterdam Study I–III (N=10,792) as a function of the optimal polygenic risk score (including 7,303 variants at P ≤ 0.005 explaining 7.8% of the variance of SphE; Supplementary Table 9). Mean OR of myopia (black line) was calculated per polygenic risk score category using the lowest category as a reference. High myopia (SphE ≤-6 D), moderate myopia (SphE >-6 D & ≤ −3 D), low myopia (SphE > −3 D & <-1.5 D), emmetropia (SphE ≥ −1.5 D and ≤ 1.5 D), low hyperopia (SphE > 1.5 D & < 3 D), moderate hyperopia (SphE ≥ 3 D & 6 D), high hyperopia (SphE ≥ 6 D).
