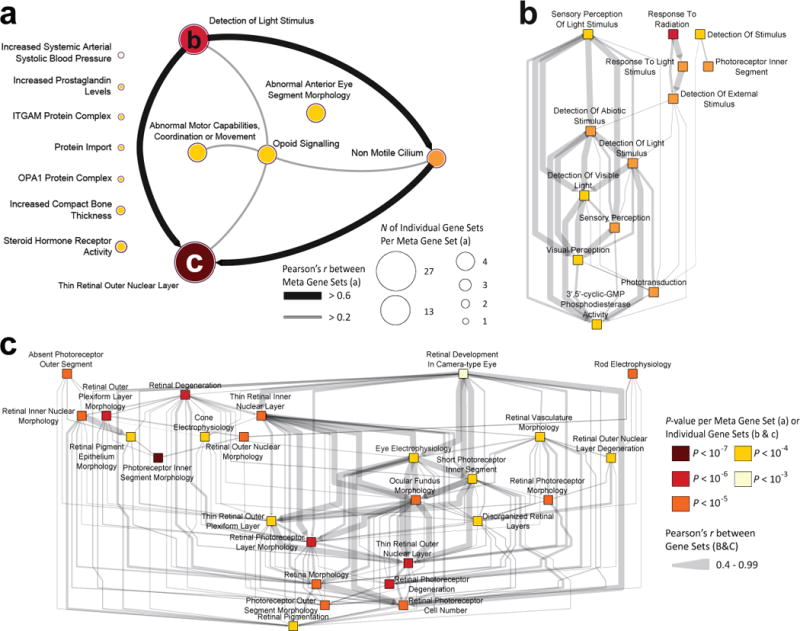
Figure 4. Visualization of the DEPICT gene-set enrichment analysis based on loci associated with refractive error and the correlation between the (meta)gene sets.

(a) Shown are the 66 significantly enriched reconstituted gene sets clustered into thirteen meta gene sets based on the gene set enrichment analysis of DEPICT (pairwise Pearson correlations; P < 0.05). All genetic variants with a P < 1 × 10⁻⁵ in the GWAS meta-analysis of stage 3 (n=21,073) and an FDR < 0.05 were considered. (b) Visualization of the interconnectivity between gene sets (n=13; pairwise Pearson correlations; P < 0.05) of the meta gene set ‘Detection of Light Stimulus’ (GO:0009583). (c) Visualization of the interconnectivity between gene sets (n=27; pairwise Pearson correlations; P < 0.05) of the largest meta gene set ‘Thin Retinal Outer Nuclear Layer’ (MP:0008515). In all panels, (meta)gene sets are represented by nodes colored according to statistical significance, and similarities between them are indicated by edges scaled according to their correlation; Pearson’s r ≥ 0.2 are shown in panel (a) and Pearson’s r ≥ 0.4 are shown in panel (b,c).
