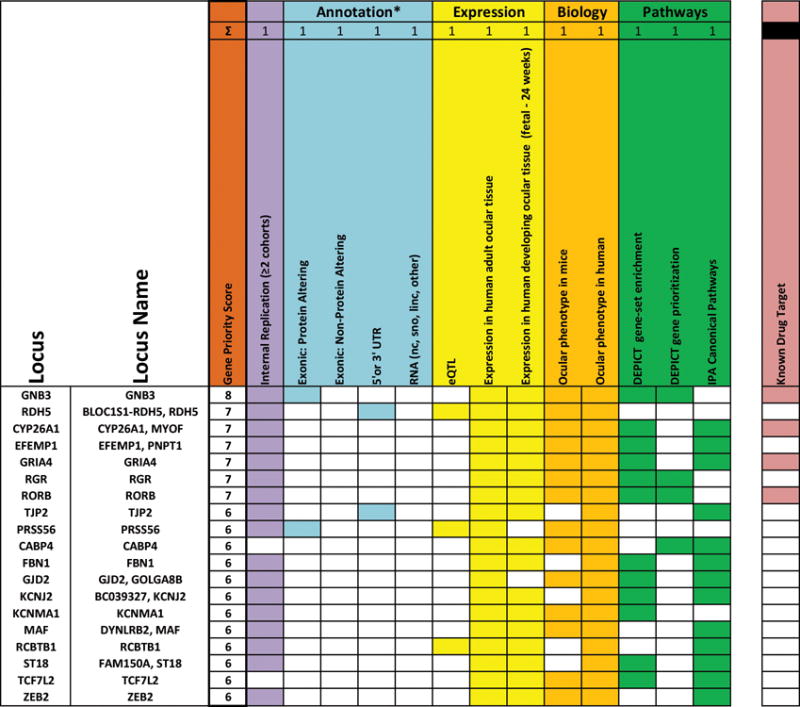
Figure 5. Genes ranked according to biological and statistical evidence.

Genes were ranked (orange) based on 10 equal categories which can be divided in four categories: internal replication of genetic variant in more than two cohorts (purple; CREAM-EUR, CREAM-ASN and/or 23andMe), annotation (light blue; genetic variant harboring an exonic protein altering variant or non-protein altering variant, genetic variant residing in a 5′ or 3′ UTR region of a gene or transcribing an RNA structure), expression (yellow; eQTL, expression in adult human ocular tissue, expression in developing ocular tissue), biology (dark yellow; ocular phenotype in mice, ocular phenotype in humans), pathways (green; DEPICT gene-set enrichtment, DEPICT gene prioritization analysis and canonical pathway analysis of IPA). We assessed genes harboring drug targets (salmon red), but did not assign a scoring point to this category.
*Only one point can be assigned in the category ‘ANNOTATION’, even though it has four columns (i.e. a genetic variant is located in only 1 of these four categories).
