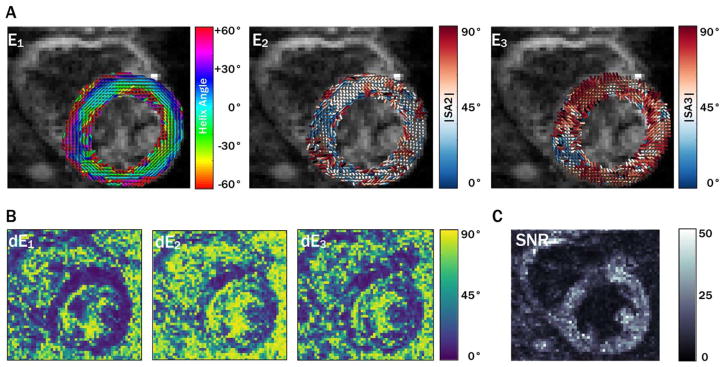
FIGURE 1.
Maps of eigenvector orientations (A) for 1 subject with 5 averages from a midsystolic cardiac phase with corresponding eigenvector orientation 95CI uncertainty maps (B) and b = 0 image SNR maps (C). Qualitatively, regions with increased uncertainty correspond with regions of eigenvector incoherence. Overall, uncertainty in E2 was greater than uncertainty in E1 and E3, a trend that was observed in all subjects.
95CI, 95% confidence interval; E, eigenvector.

