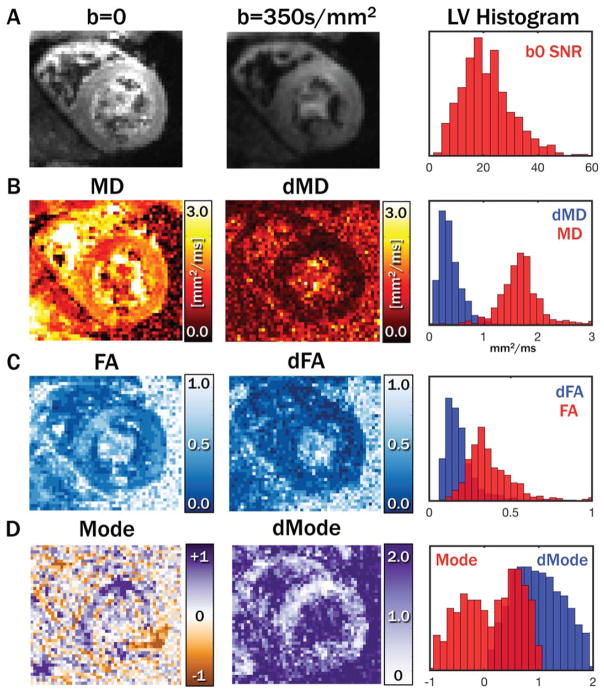
FIGURE 3.
Example systolic images with b = 0 and 350 s/mm2 with 5 averages and a histogram of LV b = 0 SNR(A). Maps of tensor MD(B), FA (C), and Mode (D), with corresponding uncertainties and LV histograms. dMD was in general low compared with myocardial MD values, whereas dFA was somewhat closer to myocardial FA. Mode was not well separated from dMode.
FA, fractional anisotropy; LV, left ventricular; MD, mean diffusivity.

