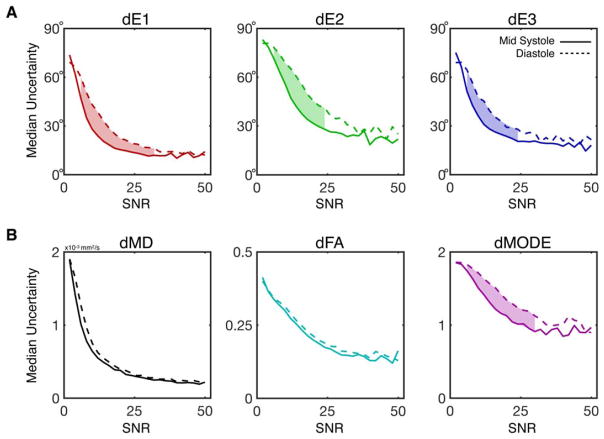
FIGURE 6.
Plots of median uncertainty in tensor eigenvalues (A) and invariants (B) as a function of b = 0 image SNR at midsystole (solid lines) and diastole (dotted lines). Median uncertainties and 95CI of the medians (not shown) were calculated from uncertainty distributions across all voxels and subjects with a particular b = 0 SNR (binned in SNR increments of 2) across images with Navg = 1–5. Significant differences between midsystole and diastole were identified by nonoverlapping 95CI and are indicated by shaded regions between the plots. dE1, dE2, dE3, and dMode were significantly lower at midsystole for moderate SNRs. Although differences in dMD or dFA were observed between phases, these differences did not reach statistical significance for any SNR bin.avg, average.

