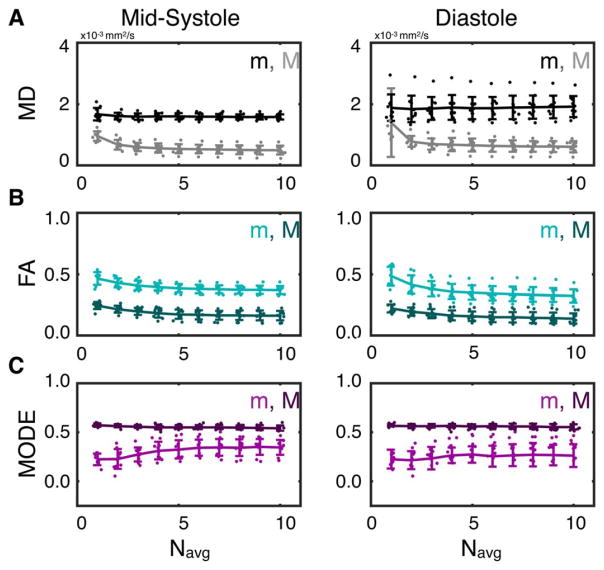
FIGURE 8.
LV medians (m) and SDs (σ) of MD (A), FA (B), and Mode (C) from midsystolic (left) and diastolic (right) cDTI with Navg = 1–10. Lines and error bars represent the population means and SDs across all subjects, and dots represent individual subject values. LVSDs decreased with increasing Navg for all parameters but with diminishing changes with Navg ≥ 4. Median FA values decreased with increasing Navg, whereas median Mode values increased. Median MD values did not change with increasing Navg.

