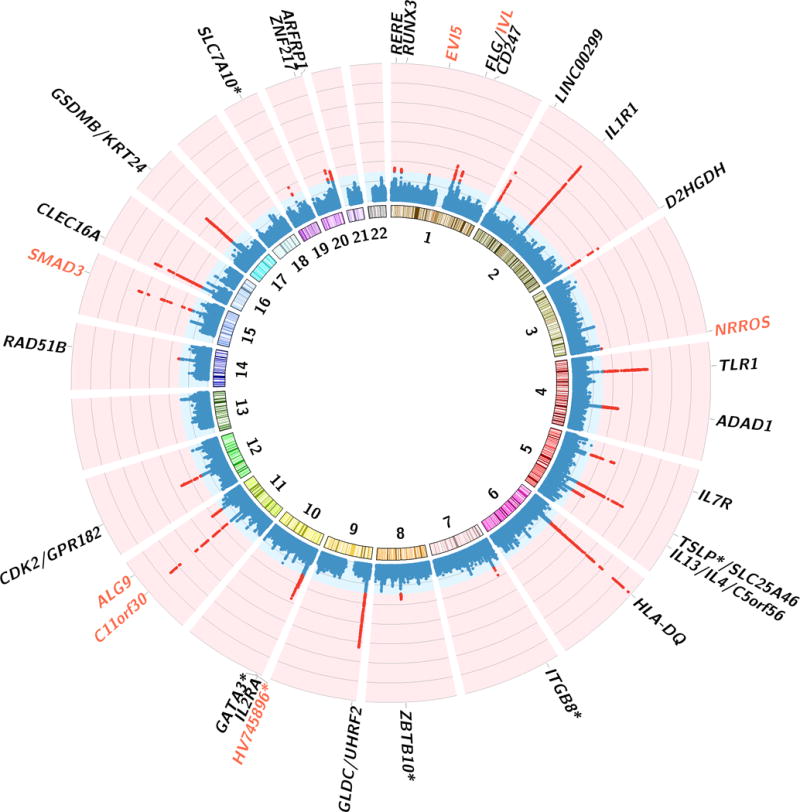
Figure 2.

Circus Manhattan plot of cross trait meta-analysis. The first layer of the plot illustrates chromosome position and the second layer illustrates the representative genes of significant loci. Red genes are novel shared genes between asthma and allergic diseases The inside layer illustrates the significance level -log10(P-value) of asthma and allergic diseases’ shared markers from cross trait meta-analysis. Red dots means genome-wide significant (P < 5×10⁻⁸). A total of 38 independent loci were identified to be associated with both diseases. Genes at loci in close proximity were assigned one gene label separated by a slash. Sample size for asthma is 90,853, for allergic diseases is 102,453.
