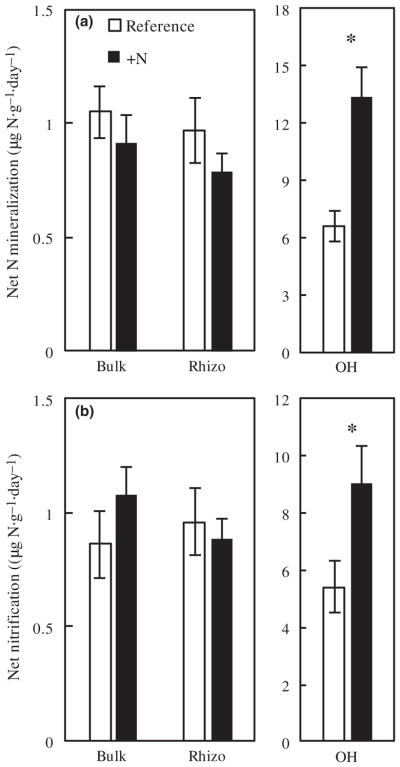
FIGURE 4.
N fertilization increases (a) N mineralization and (b) nitrification in the OH but not the mineral soil. Values are the overall watershed-level mean rates (mean ± SE) measured in June, July, and August 2015 for each soil fraction (n = 10 plots per watershed). Asterisks indicate significant differences between treatments (p < .05)

