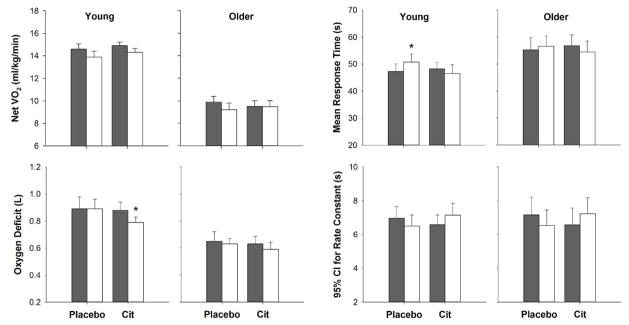
Figure 1.
Comparison of net oxygen uptake (VO2), the oxygen deficit, mean response time (MRT), and the 95% confidence interval (CI) for the rate constant before (shaded bars) and after (white bars) placebo and supplementation with L-citrulline (Cit) in young and older adults. *, significant difference compared to before supplementation after adjusting for sex, period, and sequence (p≤0.05).

