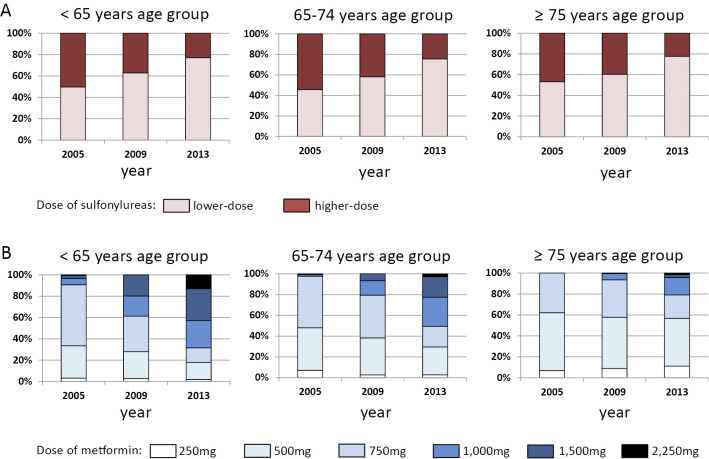
Figure 2.
Changes in the dosages of sulfonylureas and metformin. A: Prescription rates of lower-dose sulfonylurea therapy, stratified by age group in 2005, 2009 and 2013. For the present analysis, “lower-dose sulfonylurea therapy” was defined as follows: any dose of tolbutamide, ≤2 mg of glimepiride, ≤40 mg of gliclazide or ≤1.25 mg of glibenclamide. B: Dosage of metformin in the subjects stratified by age group in 2005, 2009 and 2013.

