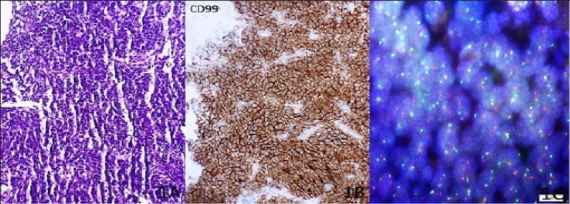
Figure 1.

Light Microscopic Appearance of Ewing’s Sarcoma Showing Diffuse Sheets of Small Sized Round to Oval Hyperchromatic Cells (H & E 10X). 1B: Diffuse strong membranous staining for CD99. 1C, FISH technique showing break apart signal representing EWSR1 gene rearrangement.
