
Figure 5.
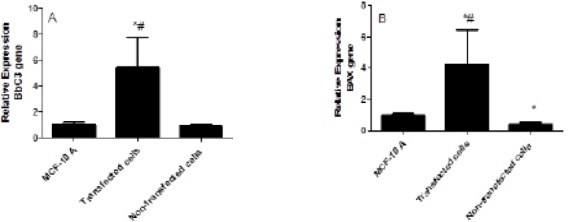
The Effect of IL-10 Silencing on the Expression Levels of BbC3 (A) and BAX (B) in MDA-231 Cell Line Compared to MCF-10 A and Non-transfected Cells. Data were presented as mean ±SEM, n = 3. * indicated significant changes from non-transfected cell line.