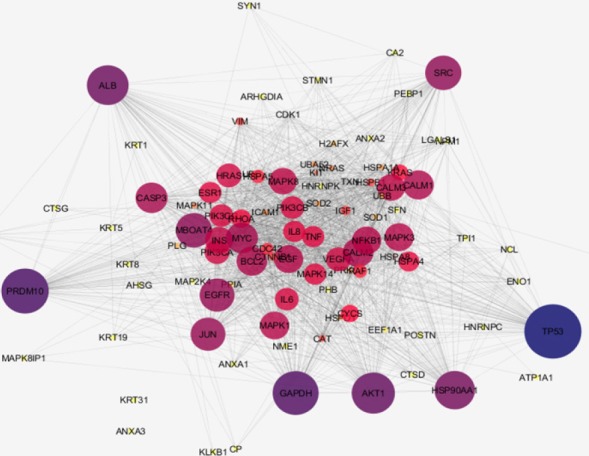
Figure 2.

Network Analysis of NPC Proteins with Addition of Neighbor Proteins. Nodes number: 97 Edge number: 1587. Confidence score: 0.5. The color changes from dark blue to yellow and the changes of node size indicate degree centrality value reduction. ANXA3 and KRT31 are remained isolated.
