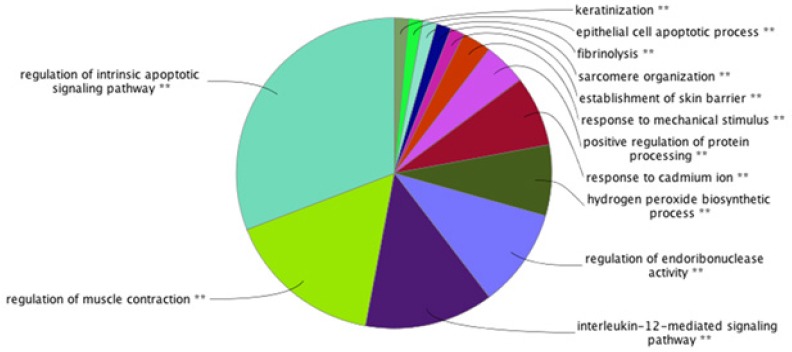
Figure 3.

Pie Chart Biological Process Analysis of NPC Related Proteins from Proteomic Studies. As it is clear, the pie chart specify which group is the most highlighted in NPC. These groups are significantly P< 0.05 associated with NPC. The light blue colored area is the most highlighted biological process for our studied proteins, which is regulation of intrinsic apoptotic signaling pathway. The other ranked bps are regulation of muscle contraction, interleukin-12-mediated signaling pathway, regulation of endoribonuclease activity, hydrogen peroxide biosynthetic process, response to cadmium ion, positive regulation of protein processing, establishment of skin barrier, sarcomere organization, fibrinolysis, epithelial cell apoptotic process, and keratinization. Number of genes per term: 3, percentage of genes per term: 4% Kappa score=0.4
