
Figure 2.
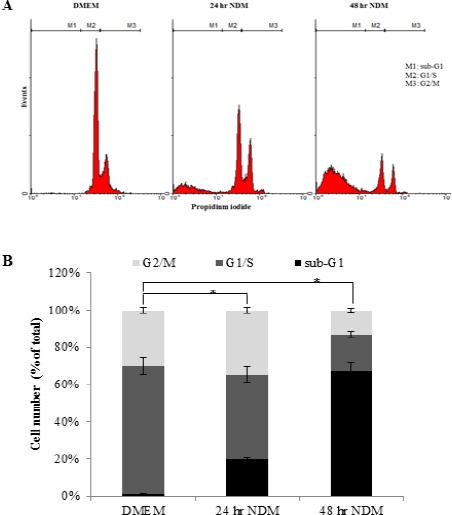
Effect of Starvation on Cell Cycle and Apoptosis of HeLa Cells. (A) Flow cytometric analysis of cell cycle distribution using propidium iodide staining after culturing the cells in DMEM or NDM for 24 hr and 48 hr. M1, sub-G1 (apoptotic) phase; M2, G1/S; M3, G2/M. (B) Cell number of each cell cycle phase was expressed as percentage of total cells. Bars represent mean ± SD. Significant difference between percentages of apoptotic cells (sub-G1 phase) is analyzed by one-way ANOVA test, where: *; P < 0.001 compared to apoptotic cells cultured in DMEM. DMEM, Dulbecco’s Modified Eagle’s Medium; NDM, nutrient-deprived medium.