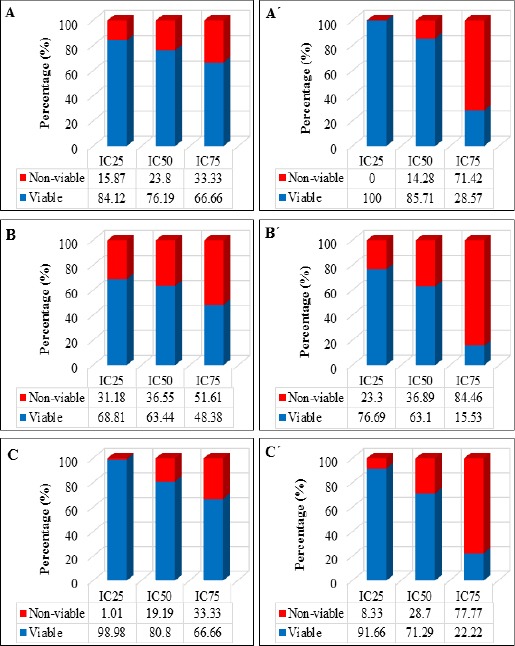
Figure 2.

The Percentage of Viable and Non-Viable H400 OSCC Cells after 24, 48 and 72h Treated with DAM and NDAM at Three Different Concentrations (IC25, IC50 and IC75). (A), DAM-treated cells for 24h; (B), DAM-treated cells for 48h; (C), DAM-treated cells for 72h; (A´), NDAM-treated cells for 24h; (B´), NDAM-treated cells for 48h; (C´), NDAM-treated cells for 72h.
