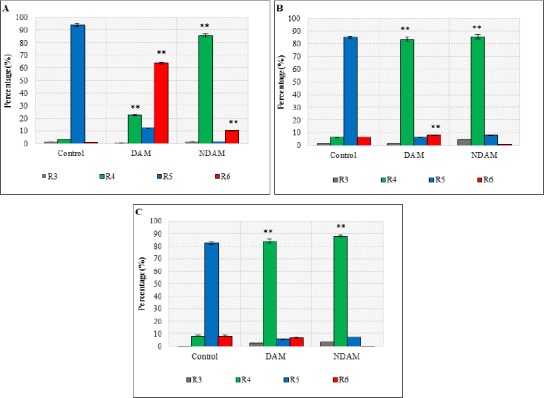
Figure 5.

The Effects of DAM and NDAM on H400 OSCC Cells after 12, 24 and 48h Using Annexin V-FITC/PI Staining Flow Cytometery. (A) 12h, (B) 24h, and (C) 48h. Treatment of H400 OSCC cells with both compounds induced apoptosis through the observation of a shift in live cell population from early to late stage of apoptosis /secondary necrosis. Significant difference from the control was *p < 0.05 and **p < 0.01.
