Abstract
Lung cancer is a frequently lethal disease often causing death of human beings at an early age because of uncontrolled cell growth in the lung tissues. The diagnostic methods available are less than effective for detection of cancer. Therefore an automatic lesion segmentation method with computed tomography (CT) scans has been developed. However it is very difficult to perform automatic identification and segmentation of lung tumours with good accuracy because of the existence of variation in lesions. This paper describes the application of a robust lesion detection and segmentation technique to segment every individual cell from pathological images to extract the essential features. The proposed technique based on the FLICM (Fuzzy Local Information Cluster Means) algorithm used for segmentation, with reduced false positives in detecting lung cancers. The back propagation network used to classify cancer cells is based on computer aided diagnosis (CAD).
Keywords: CT, CAD, FLICM, FP
Introduction
The human Lungs are pair of air-filled organs of spongy nature located on either side of the chest. Lung cancer is a disease caused by abnormal multiplying of cells as shown in Figure 1. Lung growth is one of the fundamental driver of death everywhere throughout the world (Siegel et al., 2013). As per the report generated by the World Health Organization (WHO) around 10 million patients will die of lung cancer by 2030 (World Health Organization, 2011).Lung cancer is caused by smoking often, but not always. As lung cancer gets severe by stages, its symptoms include coughing, shortness of breath, wheezing and bloody mucus. The treatment for lung cancer includes chemotherapy, radiation and surgery. Lung cancer for the most part begins in the windpipe (trachea) that goes about as the primary aviation route (bronchus) or lung tissue (Wu et al., 2010). There are three main types of lung cancer namely small cell lung cancer, Non- small cell lung cancer and lung carcinoid tumour. The types of the Lung cancer depend in transit how the cells look when examined under a magnifying lens. Non-small cell type of lung cancer is much more common than small cell lung cancer. The Most well-known instances of lung disease are a result of smoking. Lung growth is one of the main sources of death for a large portion of the patients enduring with lung disease, there are no treatments available currently for curing cancer. However there are number of diagnostic tests available for detecting cancer like sputum testing, Bronchoscopy, Needle biopsy, Thoracentesis but all these tests are very painful which requires physical contact with the body. So to avoid these painful test methods segmentation can be done for the obtained CT image of the patient (Anita and Sonit, 2012; Tian et al., 2008). But it’s not so easy to obtain results of high efficiency for Lesion extraction due to variety of reasons like lesion volume, size shape, Location, Intensity etc. Therefore an approach which is robust with good efficiency and can automatically detect lung lesion is needed (Sieren et al., 2010).
Figure 1.

The Beginning of Cancer
Related work
Lung segmentation can be performed on number of methods (Neeraj and Lalit, 2010) like thresholding based methods where grayscale input image is converted to bi-level image by either of two available thresholding algorithms namely Global thresholding type algorithm and Local/adaptive type thresholding algorithms but the drawback of this method is it doesn’t work good with attenuation variations and it is not good in pathologic classification.
Region based segmentation the main goal of this method is partitioning of an image into regions and then select seed points based on user criterion this method is better than thresholding because it will be capable of segmenting the regions with abnormalities ranging from moderate to higher level but it is sensitive to noise and is computationally expensive.
When we consider watershed segmentation in spite of working on image this technique is applied on its gradient image where each object is differentiated from the background by the edges that are up-lifted furthermore, it depends on three focuses, points that belongs to regional minimum or watershed of a regional minimum and catchment basin, Divide lines/watershed lines but this method is very complicated and it will not lead to accuracy of expected level.
Lung tumour segmentation process is based on level set and support vector machine (SVM). Firstly, tumour region is detected by statistical learning method, the image training of the classifier is trained based on the image training derived from the block features by considering the parameters of the image like texture, shape and gray features as its basic terms of classification for the test samples, and morphological gradient is considered for adjusting the level set model for segmentation of tumour more precisely (Diciotti et al., 2011). Once the segmentation of lesions is done, initial evolving contour is extracted based on the edges of lesions, which results in the elimination of noise and enhancement of edge information; however it additionally attempts in retaining the marginal integrity. But when tumour and its surrounding tissue are absolutely penetrated, tumour features and its information may be surprisingly susceptible, thus the accuracy of this method is also very low.
The graph cut method is used to segment the lung tumour by taking the weighted graphs and computing the edges to cut and gives accurate results based on two models first is segmentation based on gradient of an image and second is segmentation based on mean intensity. But this method is suitable only for images with rich texture, colour and complex backgrounds.
In this paper an effective clustering method is implemented for accurate segmentation of lung tumour in CT scan with more accuracy when compared to existing methods of clustering methods like FCM.
Materials and Methods
Proposed method
Image Acquisition
This is the foremost step is image acquisition. The images are usually collected from Hospitals or Lung Image Database Consortium (LIDC) (Armato et al., 2011). If the lung images type are of X-ray and MRI has more noise compared to CT images that is the reason for considering CT image. The CT images has Salt and Pepper, Gaussian, Speckle and Poisson noise. So the image needs pre-processing to eliminate the noises.
Figure 2.
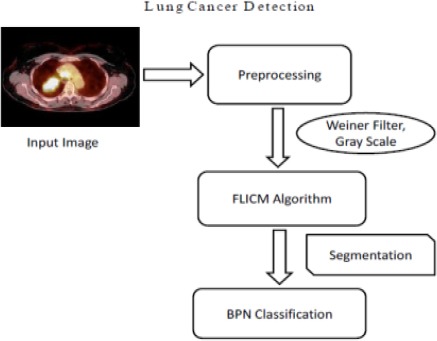
Block Diagram of Proposed System
Figure 3.
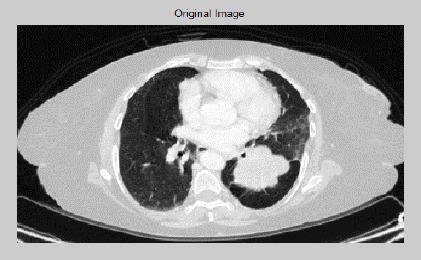
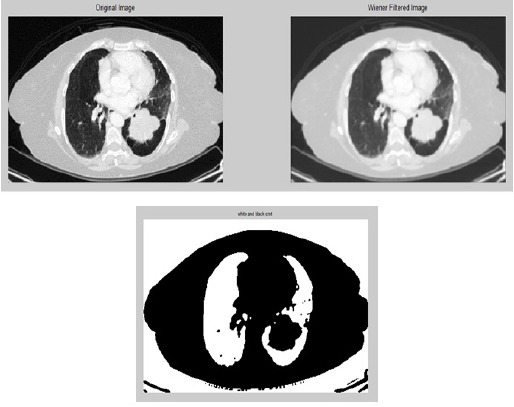
Original Image of CT Lung with Nodule
Figure 4.
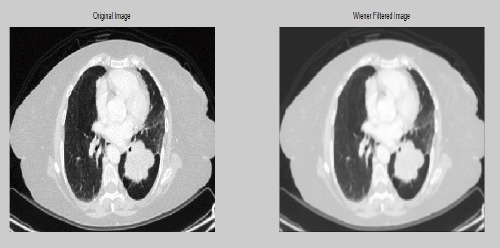
Comparison of Original Image with Pre-Pro Cessed Image
Image pre-processing
The main purpose of pre-processing is to lessen the amount of noise with minimum mean square value for the image. Image pre-processing is a method for enhancing the quality of the original image where after enhancing the image quality is far better when compared with that of the original image. The obtained original CT image is obtained and it is pre-processed using wiener filter as it is better for noise removal compared to other filters.
Image segmentation
The pre-processed image is then segmented using FLICM algorithm. Image segmentation is a process in which the original image is subdivided into multiple segments like gray level, colour, texture, brightness and contrast (Jiangdian et al., 2015). This is normally used to diagnose objects or other related information in digital images such as tumour, lesion, and abnormalities. There are variety of ways to carry out image segmentation including methods (Diciotti et al., 2008) like Region extraction, Thresholding, Edge detection and Clustering (Diciotti et al., 2008). In this paperwork clustering method of segmentation is carried out. Clustering is a function of gathering set of objects in the same group is similar to each other than those set of objects in other group. Clustering can be done in two ways: hard clustering and fuzzy clustering. Hard clustering type of data set belongs to one cluster. So it has some disadvantages like finite low contrast, spatial resolution, noise, overlapping intensities, and non-uniform intensity which reduce the efficiency of various hard clustering methods in segmentation process. Whereas in fuzzy clustering method each data can belong to more than one cluster. Clustering is a procedure of allotting information focuses to groups with the end goal that things in same group will be as comparable as could reasonably be expected and things in various group will be as unique as could be allowed. Among these clustering methods FCM is the basic clustering method. In this paper FLICM method is used by introducing local spatial and gray level information to FCM algorithm which enhances its execution in terms of robustness for all kinds of noise and outliers which results in better output.
Segmentation using Fuzzy Local Information C-Means Algorithm (FLICM) Clustering
Algorithm
FLICM algorithm has some distinct characteristics like
It is independent on type of noise and parameter selection
It incorporates relationship between local spatial and gray level that is similar to fuzzy logic
The automatic determination of fuzzy local constraints
The clustering performance is enhanced by balancing noise and image details using fuzzy logic constraints
The influence of neighbourhood pixels is controlled based on the distance between neighbourhood pixels and central pixel
It makes use of the original image by avoiding pre-processing which could cause missing of image details This local spatial and gray level information is introduces into the function and the function can be defined as:


Figure 5.
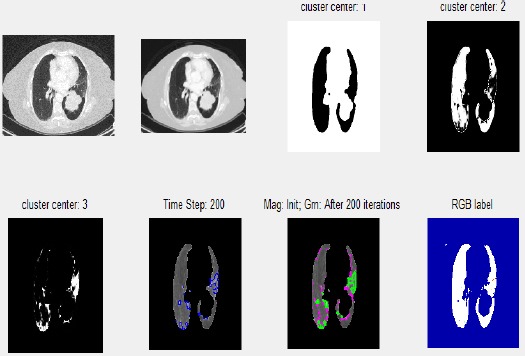
Step by Step Process of Segmentation and Lesion Detection Using GUI
Figure 6.
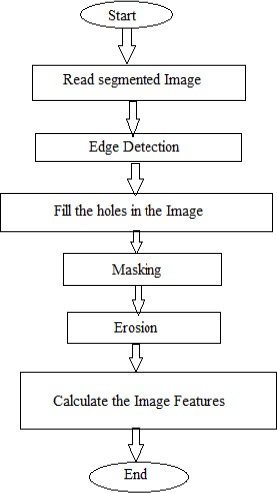
Flow Chart of Features Extraction Program
The algorithm is as follows:
Step 1: Set the quantity of cluster prototypes c, fuzzification factor m and stopping condition ε
Step 2: Initialize fuzzy segregation matrix at random
Step 3: Set (b=0), b=loop counter
Step 4: Calculate the cluster prototypes utilizing equation (3)
Step 5: Compute the membership values using equation (2)
Step 6: If the condition max stop the execution, else set b=b+1 and repeat from step 4.\
Feature Extraction
After the process of segmentation, segmented nodule of a lung lesion are utilized for feature extraction (Lin and Yan, 2002) which acts as one of the important steps for providing more detailed information about the image.
The physical features extracted are:
1) Area: Area is the aggregate of area of pixel points in the image that are usually registered as 1 in the binary image A = n{1}
2) Perimeter: The perimeter is the total number of pixels in the edge of the object.
3) Eccentricity: It is the proportion of the distance between the length of the major axis and foci of the ellipse usually the value lies between 0 and 1.
Figure 7.
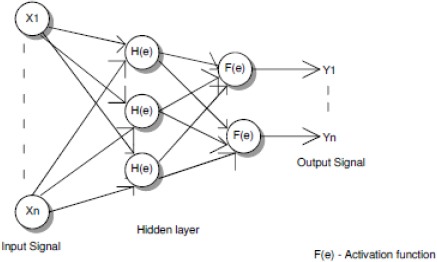
Classification Using Back Propagation Network
Image Classification
After the feature extraction process the image is lassified based on the features extracted using BPN algorithm.
Step 1: Designing the input parameters and the structure of neural network
Step 2: Initializing the weights value W as random value
Step 3: Input the target matrix T and training data matrix X
Step 4: Calculate the output vector of each unit in the neural network
a.Calculate the value of output vector H in hidden layer


Where netkis the activation function and Өk is the threshold value
b. Calculate the value of output vector Y in the output layer


where netjis the activation function and Өj is the threshold value
Step 5: Calculate the error value
a. Calculate the error value of output layer

Where  is the derivative of the activation function
b. Calculate the error value of the hidden layer

Step 6: Calculate the modification values of W and Ө with ɑ as the learning rate parameter
a. Calculate the modification value of W and Ө in the output layer


b. Calculate the modification value of W and Ө in the hidden layer


Step 7: Restore the value of Ө and W
a. Restore the value of W and Ө in the output layer


b. Restore the value of W and Ө in the hidden layer


Step 8: Repeat from step 3 to step 7 for all inputs
Results
The new FLICM based algorithm is used for image segmentation in MATLAB version 13. The algorithm proposed is realized in a step by step process and then applied over the images obtained from the database that is publicly available. For the measurement of the performance (Wen et al., 2010) of the methodology for segmentation these are the following parameters to be considered:
Sensitivity=TP/(TP+FN)
Specificity=TN/(TN+FP)
Accuracy=(TP+TN)/TP+FN+TN+FP)
Positive predictive Value(Ppv)=TP/(TP+FP)
-
Negative predictive value(Npv)=TN/(TN+FN)
These parameters are analysed and tabulated, where
TP represents true positive: The segmented slice that has cancer nodule is classified as cancerous
FP indicates false positive: The Segmented slice that does not has cancer nodule is classified as cancerous
TN indicates true negative: The Segmented slice that does not has cancer nodule is classified as non- cancerous
FN indicates false negative: The Segmented slice that has cancer nodule is classified as non-cancerous
The graphical representation of sensitivity, specificity, PPV, NPV and Accuracy are shown in Figure 8. It oints that the sensitivity value decreases with the increase in the number of images, specificity value also increases with increase in number of images, the value of PPV also increases as the number of images increases, the value of NPV decreases as there is increase in number of images, accuracy also increases as the number of images increases.
Figure 8.
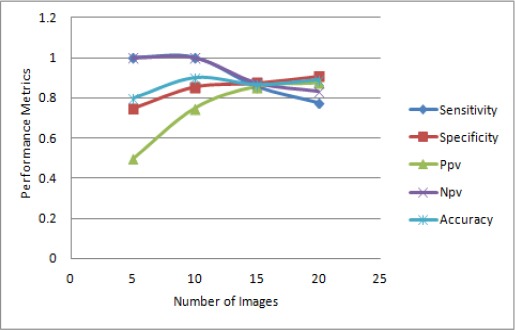
Performance Parameters for Proposed Method
Staging Cancer
Table 1.
Lung Cancer Detection Performance Parameters Values
| Images | Sensitivity | Specificity | Ppv | Npv | Accuracy |
|---|---|---|---|---|---|
| 5 | 1 | 0.75 | 0.5 | 1 | 0.8 |
| 10 | 1 | 0.857 | 0.75 | 1 | 0.9 |
| 15 | 0.8571 | 0.875 | 0.857 | 0.875 | 0.866 |
| 20 | 0.777 | 0.909 | 0.875 | 0.833 | 0.87 |
| average | 0.9087 | 0.84775 | 0.7455 | 0.927 | 0.859 |
Equivalent Diameter, 5.23; Perimeter, 21.6569; Area, 42; Eccentricity, 0.9233; stage 1 Cancer
Table 2.
Criteria for T Descriptor
| Stage parameter | T1 | T2 | T3 | T4 |
|---|---|---|---|---|
| Equivalent diameter(cm) | 5 to 7 | 7 to 11 | 11 to 21 | 21 to 42 |
| Perimeter(pixels) | 18 to 25 | 25 to 38 | 38 to 80 | 80 to 177 |
| Area(pixels) | 0 to 57 | 57 to 100 | 100 to 352 | 1446 |
T1, indicates Stage 1 cancer; T2, indicates stage 2 cancer; T3, indicates stage-3 cancer; T4, indicates stage 4 cancer.
Discussion
In this paper a robust method a robust method for segmentation is introduced. Initially pre-processing process is conducted using wiener filter for elimination of noise and image enhancement. In the subsequent step segmentation of lung lesion is performed using FLICM algorithm. The segmentation process is further classification of lung tumour severity and diagnosis. The proposed method aims at automatic detection of lung lesion using FLICM algorithm and classification is done using BPN network. The segmentation enhances the accuracy of the classification with the identification of lung lesion. Therefore the proposed approach yields better execution as far as accuracy is concerned in the prediction of lung nodule rather than already available approach.
References
- Anita C, Sonit SS. Lung cancer detection on CT images using image processing. IEEE Comput Society. 2012;4:142–46. [Google Scholar]
- Armato SG, McLennan G, Hawkins D, et al. The lung image database consortium (LIDC) and image database resource initiative (IDRI):a completed reference database of lung nodules on CT scans. Med Phys. 2011;38:915–31. doi: 10.1118/1.3528204. [DOI] [PMC free article] [PubMed] [Google Scholar]
- Diciotti S, Picozzi G, Falchini M, et al. 3-D segmentation algorithm of small lung nodules in spiral CT images. IEEE Trans Inf Technol Biomed. 2008;12:7–19. doi: 10.1109/TITB.2007.899504. [DOI] [PubMed] [Google Scholar]
- Diciotti S, Lombardo S, Falchini M, et al. Automated segmentation refinement of small lung nodules in CT scans by local shape analysis. IEEE Trans Biomed Eng. 2011;58:3418–28. doi: 10.1109/TBME.2011.2167621. [DOI] [PubMed] [Google Scholar]
- Jiangdian S, Caiyun Y, Li F, et al. Lung lesion extraction using a toboggan based growing automatic segmentation approach. IEEE Trans. Med Imaging. 2015;10:1–16. doi: 10.1109/TMI.2015.2474119. [DOI] [PubMed] [Google Scholar]
- Lin D, Yan C. Lung nodules identification rules extraction with neural fuzzy network. IEEE Neu Infor Process. 2002;4:2049–53. [Google Scholar]
- Neeraj S, Lalit MA. Automated medical image segmentation techniques. J Med Physics. 2010;35:3–14. doi: 10.4103/0971-6203.58777. [DOI] [PMC free article] [PubMed] [Google Scholar]
- Sieren JC, Weydert J, Bell A, et al. An automated segmentation approach for highlighting the histological complexity of human lung cancer. Ann Biomed Eng. 2010;38:3581–91. doi: 10.1007/s10439-010-0103-6. [DOI] [PMC free article] [PubMed] [Google Scholar]
- Siegel R, Naishadham D, Jemal A. Cancer statistics. CA Cancer J Clin. 2013;63:11–30. doi: 10.3322/caac.21166. [DOI] [PubMed] [Google Scholar]
- Tian J, Xue J, Dai Y, et al. A novel software platform for medical image processing and analyzing. IEEE Trans Inf Technol Biomed. 2008;12:800–12. doi: 10.1109/TITB.2008.926395. [DOI] [PubMed] [Google Scholar]
- Wen Z, Nancy Z, Ning W, et al. Sensitivity, specificity, accuracy, associated confidence interval and ROC analysis with practical SAS®implementations. Health Care Life Sci. 2010;29:1–9. [Google Scholar]
- World Health Organization. Description of the global burden of NCDs, their risk factors and determinants, Burden:mortality, morbidity and risk factors, 2011. Geneva, Switzerland: World Health Organization; 2011. pp. 9–32. [Google Scholar]
- Wu D, Lu L, Bi J, et al. Stratified learning of local anatomical context for lung nodules in CT images. IEEE Trans Med Imaging. 2010;25:2791–98. [Google Scholar]


