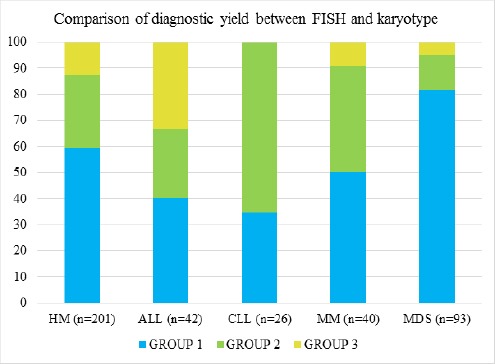
Figure 1.

Graph Showing Percentage of Group 1 (concordance between the two modalities), Group 2 (FISH advantageous) and Group 3 (CCS advantageous). X-axis: Sample size (%), Y-axis: Individual HMs.

Graph Showing Percentage of Group 1 (concordance between the two modalities), Group 2 (FISH advantageous) and Group 3 (CCS advantageous). X-axis: Sample size (%), Y-axis: Individual HMs.