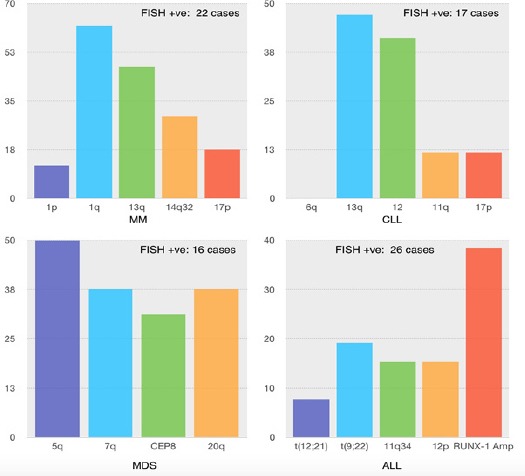
Figure 2.

Graphical Representation of CA Picked up by FISH in HM, X-axis: Chromosomal Aberration targeted by specific FISH probe, Y-axis: Incidence in percentage within FISH positive sample group

Graphical Representation of CA Picked up by FISH in HM, X-axis: Chromosomal Aberration targeted by specific FISH probe, Y-axis: Incidence in percentage within FISH positive sample group