
Figure 3.
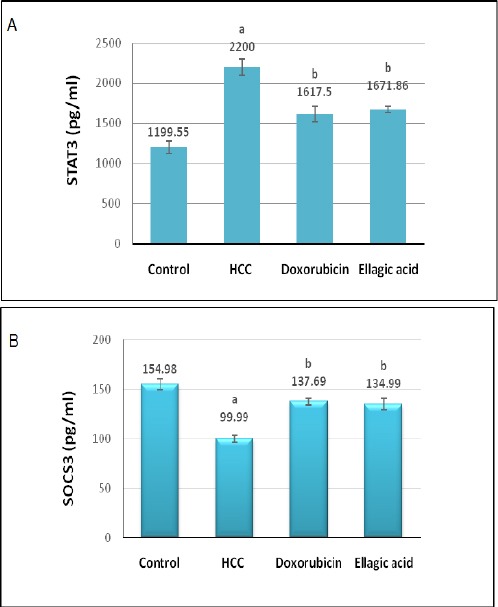
Effect of Treatment with Doxorubicin or Ellagic Acid on Serum STAT3 (A) and SOCS3 (B) Levels in HCC Rat Model. (a) Significant change at P>0.05 in comparison with the negative control group, (b) Significant change at P>0.05 in comparison with the HCC untreated group.