
Figure 5.
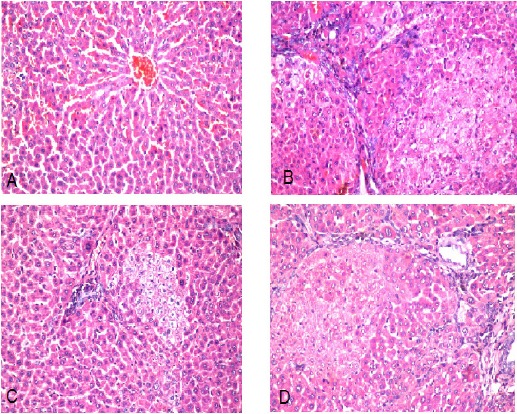
Photomicrograph of Liver Section of (A) negative control group shows normal histological structure of central vein (cv) and surrounding hepatocytes in the parenchyma. (H and E x 10), (B) HCC untreated group shows group of dysplastic hepatocytes with prominent nucleolus. (H and E x 40), (C) HCC + Doxorubicin group shows sever congestion in portal vein. (H and E x 40), (D) HCC + Ellagic acid group shows focal area of degenerated dysplastic with prominent nucleoli hepatocytes. (H and E x 40)