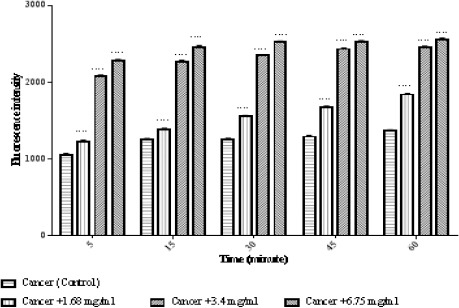
Figure 4.

Effects of Matrine on MMP Decline in ALL Mitochondria. Columns represent mean of Rhodamine123 fluorescence intensity in ALL mitochondria treated with matrine for 5-60 minutes. Values (mean ± S.D.) are from three independent experiments (n = 3). **** p < 0.0001.
