
Figure 11.
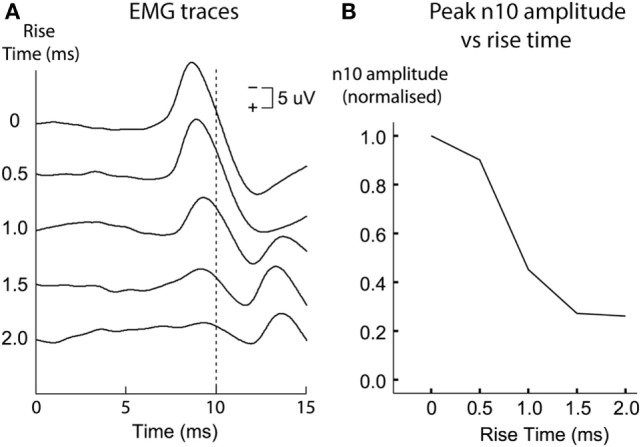
Ocular vestibular-evoked myogenic potential (oVEMP) responses [(A) time series for each stimulus type; (B) amplitudes of the n10 peak] from a subject receiving 500 Hz bone-conducted vibration stimuli at the midline of forehead at the hairline. Tone bursts of varying rise times (ramps) were presented in random order. The size of the n10 component of the oVEMP depends on the rise-time of the tone burst stimulus: increasing the rise time causes a systematic reduction of the n10 amplitude. This is quantified in panel (B), where n10 amplitude is plotted against rise-time. Reprinted by permission from Wolters Kluwer Health, Inc.: Burgess et al. (98), © 2013.