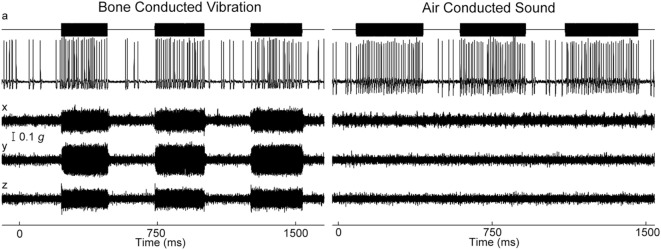
Figure 3.
Time series of firing of an irregular otolith neuron during stimulation by bone-conducted vibration (BCV) and air-conducted sound (ACS) at 500 Hz—both stimuli cause stimulus-locked activation. The top trace (a) shows the command voltage indicating when the stimulus is on. The second trace shows the extracellular recording. The three bottom traces (x, y, z) show the triaxial accelerometer recording of the stimulus. The left panel is an example of BCV stimulation and the right of ACS stimulation of the same neuron. Note the scale of stimulus intensity in g at the left margin between traces x and y. Reprinted by permission from Springer Nature, Curthoys and Vulovic (29), © 2011.

