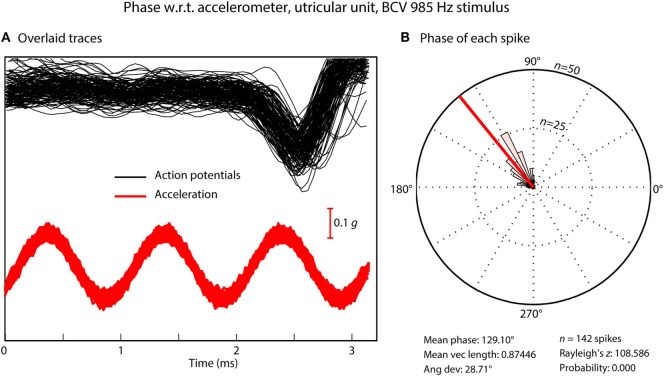
Figure 4.
(A) Time series of action potentials in response to a bone-conducted vibration stimulus (shown by the red acceleration trace). Traces which contain a spike of neural firing are aligned using the timing of the stimulus pulse. (B) Circular histogram (rose plot) of the phase of each spike; the small and large concentric circles represent n = 25 and n = 50 spikes, respectively. The Rayleigh test of circular uniformity was performed on the 142 spikes, and was significant (p < 0.001), showing that the time when an afferent is activated is phase locked to the stimulus. Here, the neuron misses many cycles (A), as can be seen from the value of the action potentials which contain no spikes in the cycles preceding each instance of firing, but the time when the neuron fires is locked to a narrow band of phase angles of the stimulus (B). Clearly each individual cycle of the stimulus is acting to activate the receptor/afferent.

