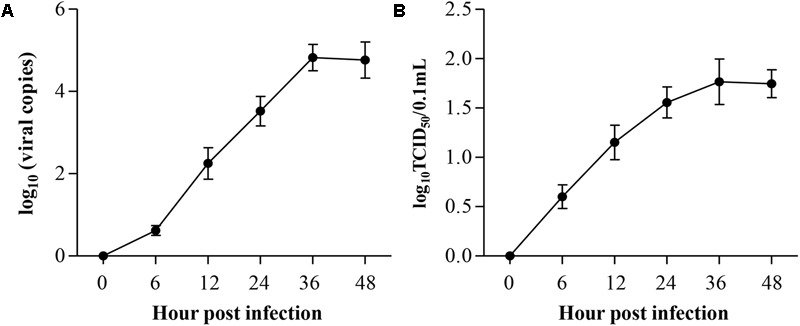
FIGURE 1.

Replication kinetics of ALV-J in HD11 cells. HD11 cells were infected with the indicated dose. At different time points after ALV-J infection, the viral loads were determined by qRT-PCR (A) and TCID50 assay (B). The graphs show the averages of viral loads from three individual experiments. Results are representative of three independent experiments. Data are represented as mean ± SD, n = 3.
