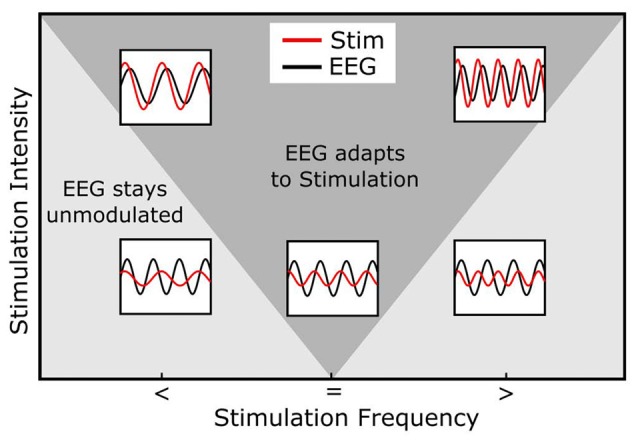
Figure 3.

Arnold Tongue. The horizontal axis represents the stimulation frequency with smaller (<), equal (=) or higher (>) stimulation frequencies relative to the endogenous frequency. The vertical axis shows the stimulation intensity. The inlays depict the relationship between the endogenous (e.g., EEG, black) and stimulation signal (red). Note how the stimulation signal increases in amplitude from bottom to top and how its frequency relates to the EEG signal. During stimulation, the endogenous oscillation couples in phase and frequency to the stimulation signal (entrainment) in cases inside of the Arnold Tongue (dark gray area) and stays unmodulated out of the Arnold Tongue (light gray area). When the stimulation frequency is identical with the endogenous frequency, even low stimulation intensities lead to a coupling of the two oscillations (central, lower inlay). The same intensity does not lead to entrainment, when the stimulation frequency is not matched to the endogenous frequency (lower left and right inlays). If, however, the intensity is increased, these non-matched frequencies do lead to entrainment (upper left and right inlays).
