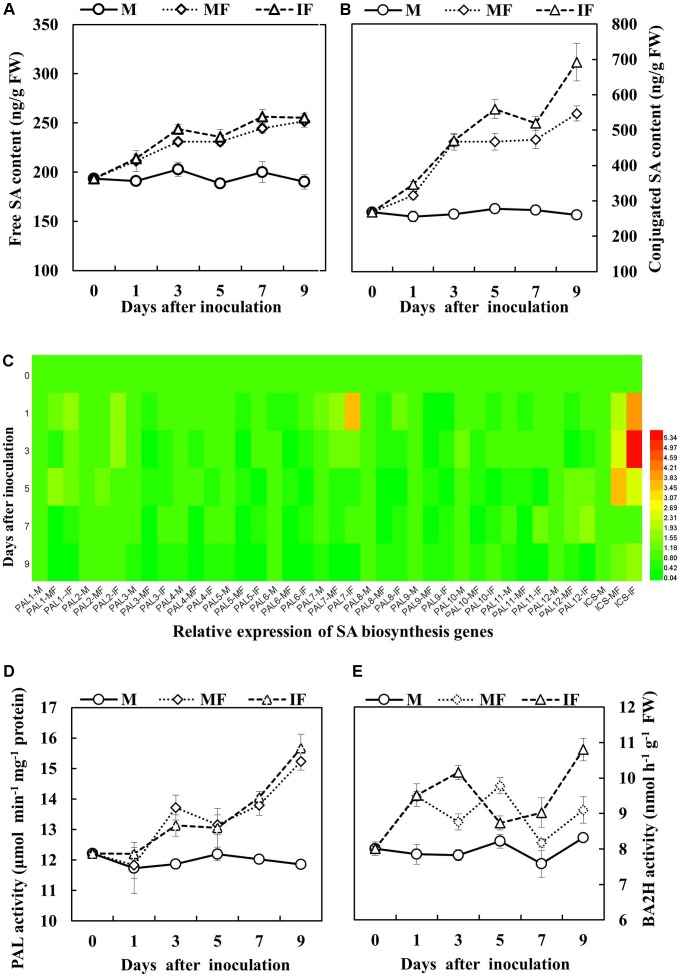
FIGURE 6.
Salicylic acid (SA) accumulation in the roots of watermelon in response to FON inoculation. (A) Free SA content. (B) Conjugated SA content. (C) Expression analysis of PAL and ICS genes using matrix cluster analysis. The intensity of the red or green color represents the extent of up-regulation of the tested gene. (D,E) PAL and BA2H activities of watermelon roots in response to FON infection. All values are presented as mean ± SE.

