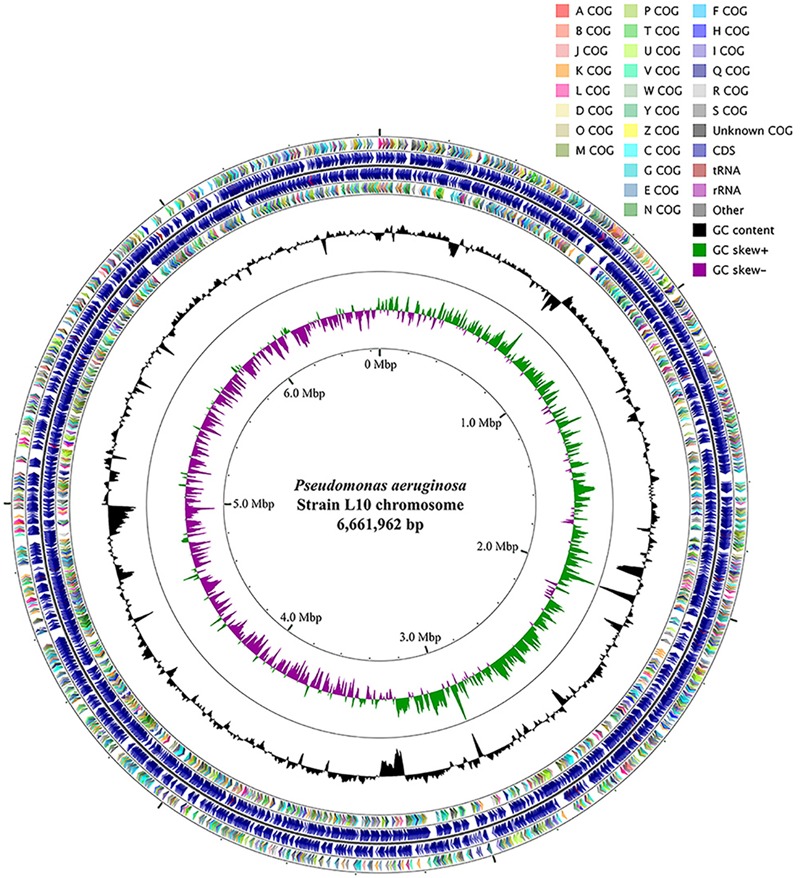
FIGURE 5.

Circular genome map of P. aeruginosa L10. From outside to center, ring 1 and 4 show protein-coding genes oriented in the forward (colored by COG categories) and reverse (colored by COG categories) directions, respectively. ring 2 and 3 denote genes on forward/reverse strand; ring 5 shows G + C% content plot, and the inner-most ring shows GC skew, purple indicating negative values and olive, positive values. The circular map was generated with GCViewer (https://github.com/chewiebug/GCViewer, last accessed January 2017).
