
Figure 1. Working model and DiI-fate mapping the AX in situ.
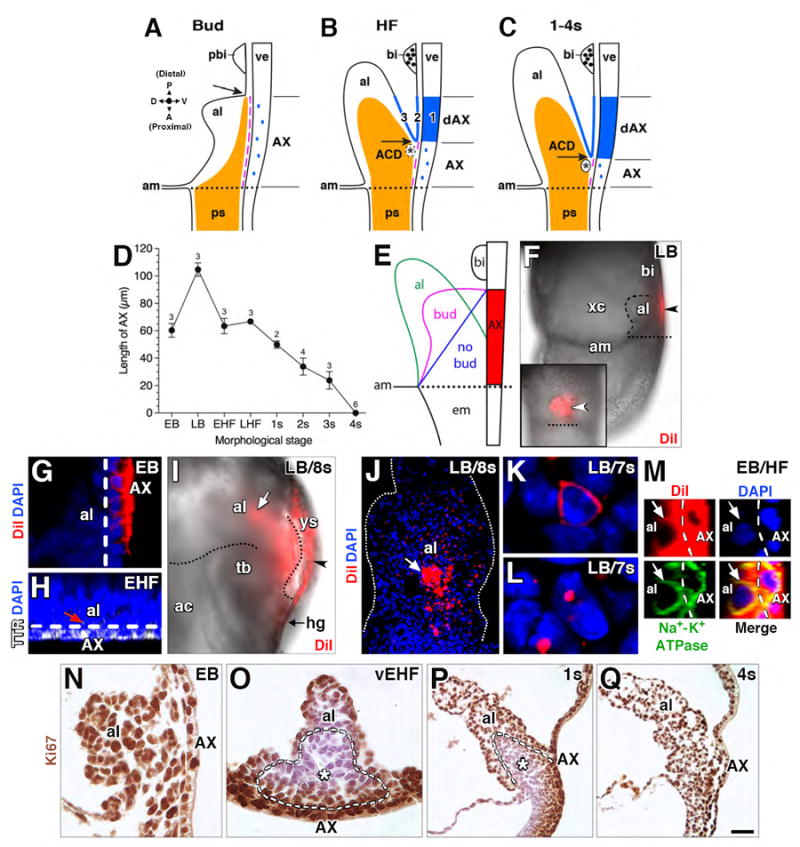
(A-C) Schematic diagram, mid-sagittal plane of the posterior embryonic-extraembryonic interface over time. Compass: posterior/distal (P), anterior/proximal (A), dorsal (D) and ventral (V). Modified, with permission from (Rodriguez et al., 2017). Spatiotemporal Ptch1 expression in this region was previously described (Daane and Downs, 2011), particularly the Ptch1-negative AX domain (Figs 1L, 2G of that study). (A) The primitive streak (ps; orange) reaches beyond the embryonic-extraembryonic boundary (dotted line) stopping short of the prospective blood islands (pbi), and defining the allantoic-yolk sac junction (black arrow). AX, separated from the streak by a continuous basement membrane (magenta), exhibits low Ptch1 (blue dots). (B) The ps expands into the allantoic core domain (ACD; orange); the nascent vessel of confluence (discontinuous black oval, asterisk) forms at the allantoic-yolk sac junction (black arrow), which has shifted anteriorly. High Ptch1 (solid blue) is now evident in distal AX (dAX; 1); yolk sac mesothelium (2); and ventral allantoic wall (3). Blood islands (bi) are present. Basement membrane (magenta line) between the streak and AX is discontinuous. (C) Mature vessel of confluence and further anterior progression of the allantoic-yolk sac junction. (D) Decreasing AX length with increasing morphological stage. Mean ± SEM with sample sizes. (E) Schematic diagram, contact between AX and allantois changes over time. Dotted line, embryonic-extraembryonic boundary. (F) Left side view (main panel) and frontal (ventral) view (inset), whole mount specimen (LB stage), restriction of initial DiI label (arrowheads) to the extraembryonic region (dotted line, embryonic-extraembryonic boundary). Dashed line delineates allantoic bud. (G) Sagittal optical section, specificity of initial DiI label to AX. Dashed line delineates AX. (H) Transverse slice through reconstructed z-stack; transthyretin (TTR) throughout AX with occasional punctate spots in allantois (red arrow), to where it was likely secreted. Dashed line delineates AX. (I) Left side view, whole mount specimen, fetal-placental interface, Di-labeled post-culture conceptus; fluorescent DiI visible on visceral yolk sac (arrowhead) and spreading into allantois (white arrow). Dotted lines delineate ventral and dorsal surface of allantois. (J) Frontal optical section of specimen in I, after removal of the visceral yolk sac, DiI label (white arrow, red color) in the allantois (white dots outline allantois). (K, L) Enlarged examples of DiI label in AX-derived mesodermal cells: fully covered (K), dotted (L). (M) Sagittal slice, reconstructed z-stack, displaying co-localization of DiI with the plasma membrane protein, Na+-K+ ATPase, in both the AX and its mesodermal derivatives within the allantois. (N-Q) Histological sections, Ki67-immunostained allantois (mid-sagittal, N, P, Q; transverse, O); with the exception of the headfold (O) and early somite stages (P), where cells within allantoic core are largely quiescent, allantoic cells in contact with the AX and the AX itself are proliferative. ACD, white asterisk and outlined by white dashed lines (O, P). Scale bar (Q): 3 μm (K, L); 7μm (M); 10 μm (G, H, N); 20 μm (O); 30 μm (J); 50 μm (P, Q); 100 μm (F, I); 150 μm (F inset). ac, amniotic cavity; al, allantois; am, amnion; bi, blood island; em, embryo; hg, hindgut; tb, tailbud; ve, visceral endoderm; xc, exocoelomic cavity; ys, yolk sac.