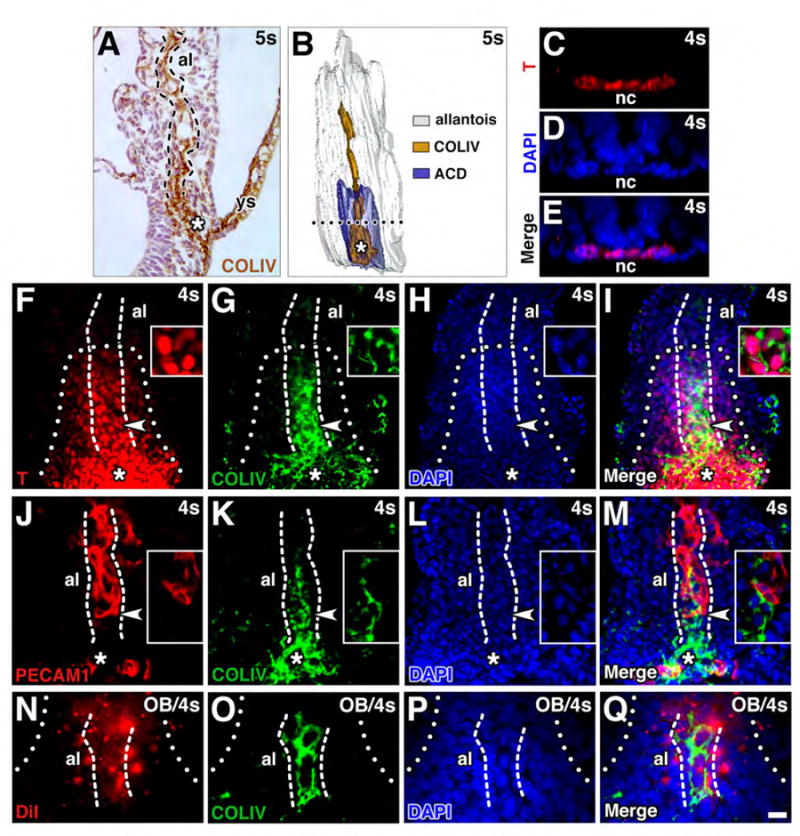
Figure 10. COLIV identifies the AX-derived allantoic rod.

For all panels, the allantoic rod is encased by dashed lines and the proximal ACD is indicated with a white asterisk. (A) Sagittal COLIV-immunostained histological section, allantoic-yolk sac interface, displaying a rod-like file of COLIV extending from the dense proximal ACD through the allantoic midline. (B) Frontal (ventral) view, 3-D model reconstructed from serial sections of specimen in A; color key displayed. Dotted line delineates the base of the allantoic rod, which lies within the dense ACD. (C-E) Transverse slice, reconstructed z-stack of the anterior embryo. T localizes to and defines the embryonic notochord. (F-I) Frontal optical section through the allantois, showing the ACD defined by T (white dotted outline) and the allantoic rod defined by COLV. Insets: high magnification of rod at level of white arrowhead, showing COLIV surrounding T-positive cells. (J-M) Frontal optical section through the allantois, showing that the nascent umbilical artery defined by PECAM1 is distinct from the COLIV rod. Insets: high magnification of region at level of white arrowhead. (N-Q) Frontal optical section through the allantois, the COLIV rod-like structure is encased with DiI, and thus derived from the AX. Scale bar (Q): 6 μm (C-E, F-I insets); 10 μm (J-M insets, N-Q); 15 μm (J-M); 20 μm (F-I); 35 μm (A). al, allantois; nc, notochord; ys, yolk sac.
