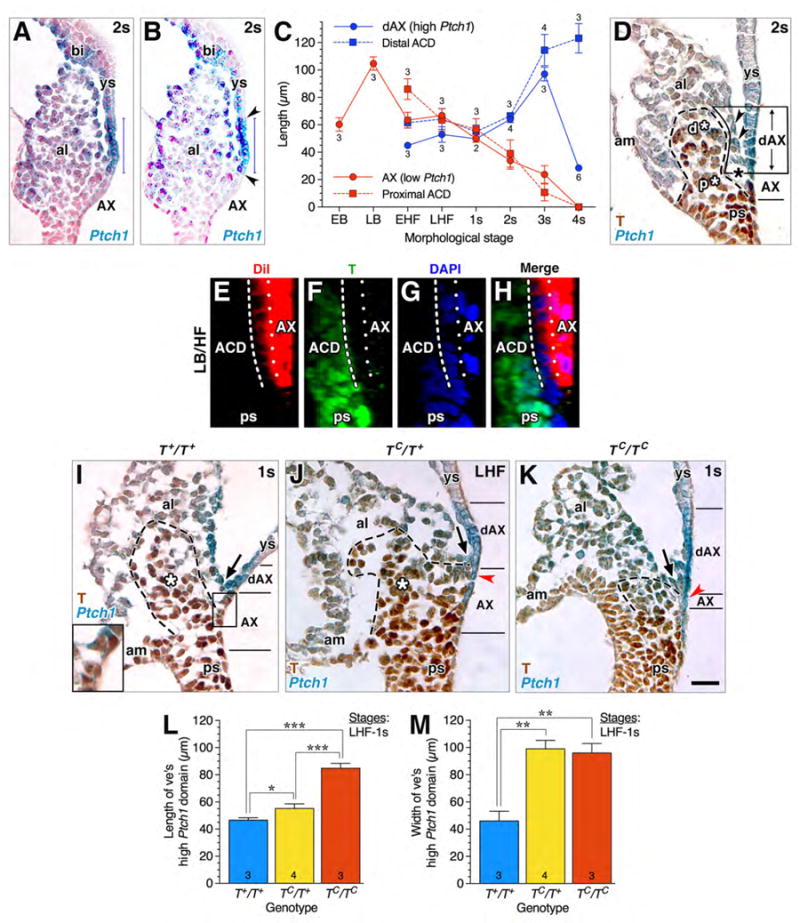
Figure 4. High Ptch1 in visceral endoderm following loss of contact with the primitive streak.

(A, B) Thresholding determined the length of high Ptch1 domain. Vertical blue lines in each panel are the ruler provided by NIS Elements. Sagittally-oriented histological section through Ptch1+/- reporter (2s stage, ~E8.25) (A). The same specimen (B) with “thresholding” to enhance the high Ptch1 domain in the dAX and confirm its borders (arrowheads). (C) Inverse relationship between AX (low Ptch1)/proximal ACD; red), and dAX (high Ptch1)/distal ACD; blue) at increasing morphological stages. Mean ± SEM, sample sizes above data points for T-stained material used to measure ACD length, and below for Ptch1:lacZ X-gal stained material used to measure AX and dAX length. (D) Sagittal histological section, allantois, showing a wedge of mesoderm within allantoic ventral wall (arrowheads) that now separates high Ptch1 dAX (formerly the low Ptch1 AX) from the largely T-positive ACD. The dAX is associated with the distal ACD (d*) and the AX is associated with the proximal ACD (p*). (E-H) Sagittal slice, reconstructed z-stack, AX-derived mesodermal cells have intervened between the AX and T-defined ACD, indicated by white dotted and dashed lines, respectively. (I-K) Sagittal histological sections of T-immunostained TC/Ptch1 littermates showing limits of high and low Ptch1 domains in each genotype; the arrow in all three panels indicates the allantoic-yolk sac junction, which separates the dAX from the AX. (I) wildtype specimen sagittally oblique; low Ptch1 in AX (boxed) is enlarged in inset. (J, K) Primitive streak is breaking down in the heterozygotes (J) and homozygotes (K), as indicating by decreasing levels of T, with overlying Ptch1 as high as in the dAX (red arrowheads). (L) Mean length ± SEM of high Ptch1 domain; sample sizes indicated. Significance: Student t-Test: *, P < 0.05; ***, P < 0.001. (M) Mean width ± SEM of high Ptch1 domain; sample sizes indicated. Significance: Student t-Test: **, P < 0.01. Scale bar (K): 16 μm (E-H); 25 μm (D, I-K). al, allantois; am, amnion; ps, primitive streak; ve, visceral endoderm; ys, yolk sac.
