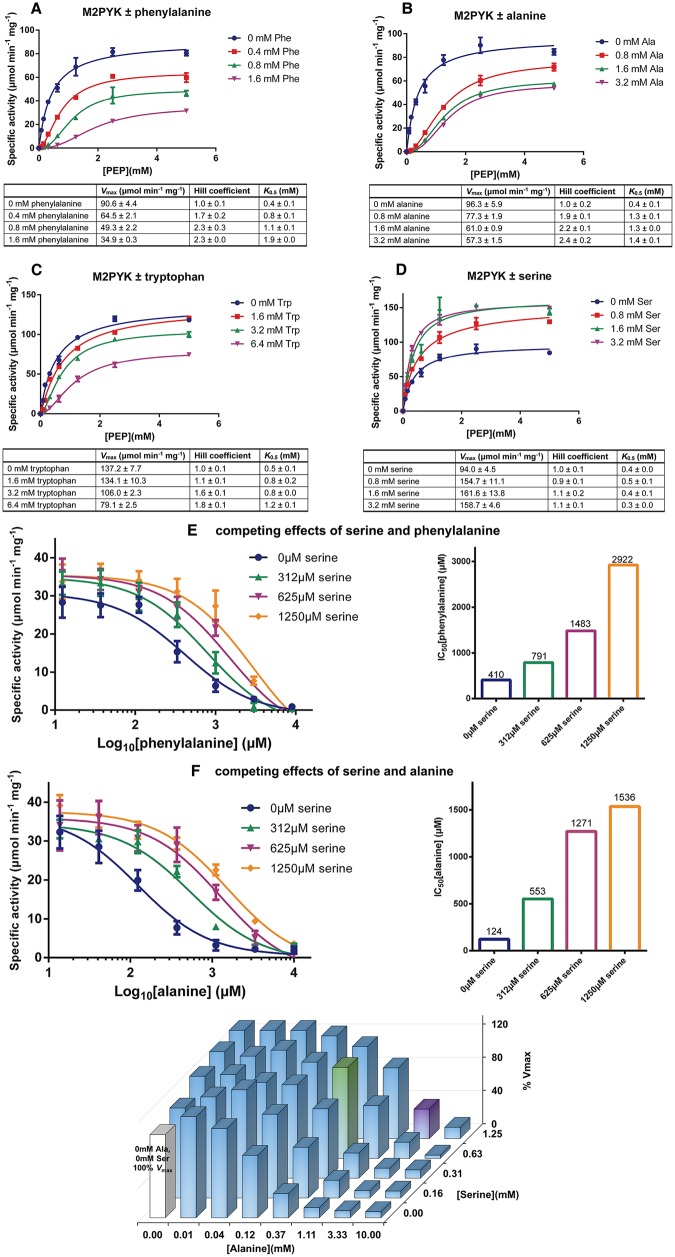
Figure 4. Effects of amino acids on M2PYK activity.
(A–D) Kinetic profiles of M2PYK determined for PEP [with saturating ADP (2 mM)] in the presence or absence of different concentrations of phenylalanine, alanine, tryptophan, and serine. Lineweaver–Burk plots are shown in Supplementary Figure S4. (E) The competing effects of serine and phenylalanine on M2PYK activity. Sub-saturating concentrations of PEP (0.4 mM) and ADP (0.5 mM) were used for this enzyme assay. (F) The competing effects of serine and alanine on M2PYK activity. The 3D histogram on the right shows relative in vitro enzymatic activity of M2PYK in the presence of different concentrations of alanine/serine. The white bar is the M2PYK activity with no amino acid ligands, calculated as 100% activity. The green bar corresponds to M2PYK activity in the presence of alanine/serine at normal intracellular concentrations, while the purple bar corresponds to that of concentrations in cancer cells (Supplementary Figure S5). Sub-saturating concentrations of PEP (0.4 mM) and ADP (0.5 mM) were used for this enzyme assay. Data represent the mean ± standard error of three independent experiments.

