
FIG. 6.
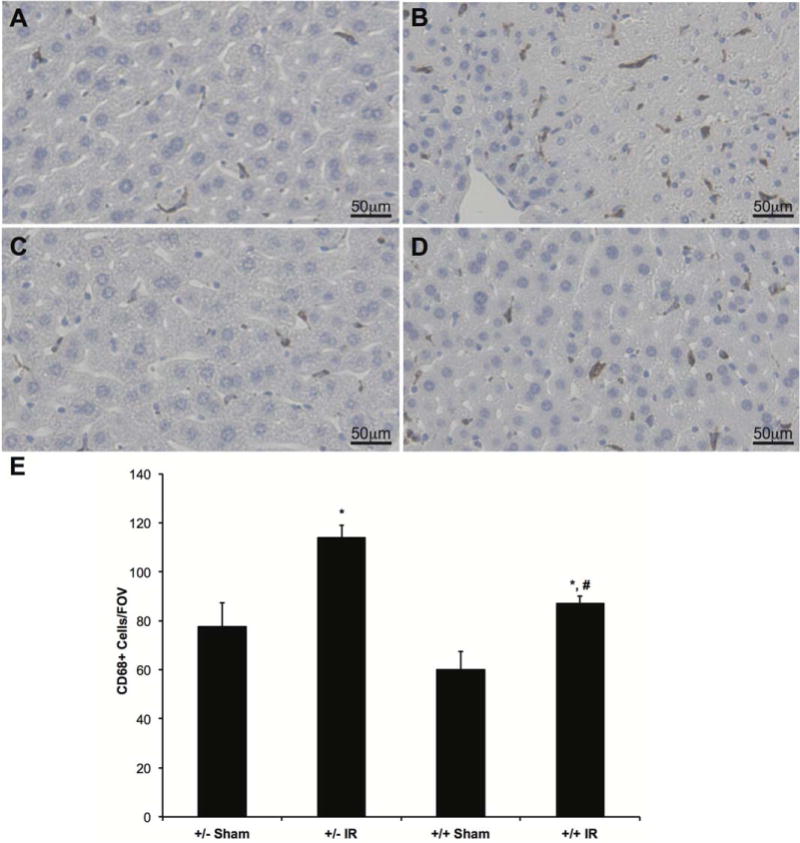
IHC for KCs and infiltrated monocytes. To evaluate the extent of monocyte infiltration and KC staining in the different groups, IHC with a CD68 antibody was performed. CD68 is a marker expressed on monocytes/immature macrophages, as well as KCs. Representative slides for (A) LysMcre+/caNrf2− sham (n = 4), (B) LysMcre+/caNrf2− IR (n = 7), (C) LysMcre+/caNrf2+ sham (n = 4), and (D) LysMcre+/caNrf2+ IR (n = 5) animals are shown. There is similar CD68 staining in the sham groups of both genotypes. After IR, there is a marked increase in CD68 staining in both IR groups, but when compared to LysMcre+/caNrf2−, CD68 staining is decreased in the LysMcre+/caNrf2+ IR group. (E) The number of CD68 staining cells was quantified for each experimental group. Similar to visual observation, there is a significantly increased number of CD68 positive cells in both IR groups, as compared to sham counterparts. We also see significantly decreased numbers of CD68 positive cells in the LysMcre+/caNrf2+ IR group as compared to the LysMcre+/caNrf2− IR group. * P < 0.05 as compared to sham group of the same genotype. # P < 0.05 as compared to +/− group of the same treatment.