FIG 1.

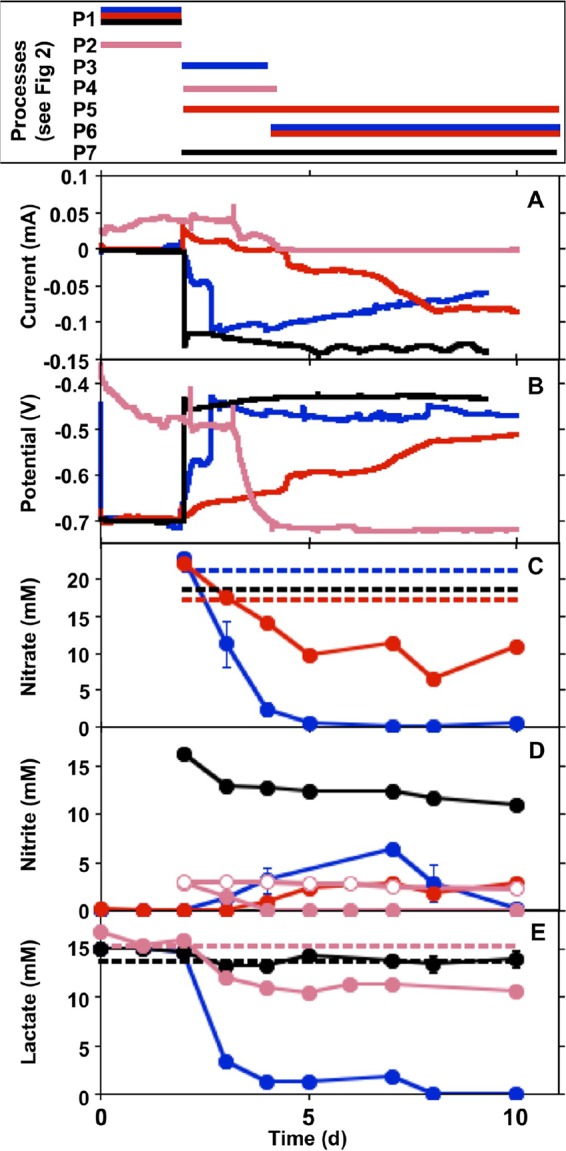
Current (A), potential (in the WE1 chamber versus a standard calomel electrode) (B), nitrate concentrations (C), nitrite concentrations (D), and lactate concentrations (E) in incubation mixtures with S. oneidensis and carbon steel coupons deployed in the WE1 and WE2 chambers of split chambers connected by ZRA. Data for incubations designated ZRA1, ZRA2, ZRA3, and ZRA4 (shown in Table 1) are depicted by blue, black, pink, and red lines or shapes, respectively. All data depicted with closed shapes indicate nitrate, nitrite, or lactate concentrations in WE1. Open circles in panel D represent nitrite concentrations in WE2. Dashed lines represent mean concentrations of nitrate or lactate measured in WE2. Error bars represent one standard deviation of data from triplicate incubations. The box at the top indicates the time periods of processes (shown in Fig. 2) associated with each type of incubation.
