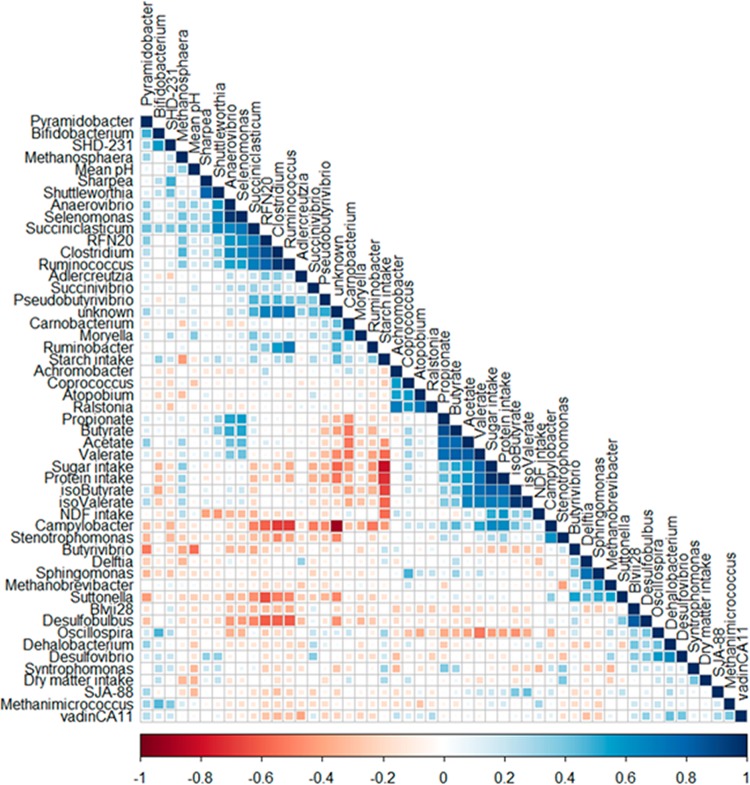
FIG 4.
Correlation heatmap using hierarchical cluster analysis of 16S rRNA sequences labeled by 97% identity to the genus level with rumen and dietary parameters, including mean pH, dry matter intake, nutrient intake (starch, sugar, protein, neutral detergent fiber [NDF] and volatile fatty acid [VFA]) composition of the rumen fluid at time of sampling, including acetate, propionate, butyrate, valerate, isobutyrate, and isovalerate. Data for dietary composition and VFA profiles of the rumen fluid have been previously published (Kleefisch et al. [19] and Klevenhusen et al. [20]). Scale indicates Pearson correlation coefficient from −1 (red) to 1 (blue). Scale is indicated by color and size of square within the heatmap. Most notably, there is a strong negative correlation between starch and sugar intake based on dietary composition, and this matches a strong negative correlation, e.g., see between Campylobacter populations and Ruminococcus populations.

